loadr
loadr is a load testing platform in a single binary. It combines the two dominant traditions in load testing:
- k6's model: scriptable tests, open/closed load models with precise executors, a first-class metrics engine with thresholds as pass/fail criteria, and a great CLI experience.
- JMeter's breadth: rich assertions (response code, body, JSONPath, XPath, size, duration), extractors (regex, boundary, CSS, XPath), timers (constant, uniform, gaussian, constant-throughput), CSV data sets, cookie management, and broad protocol coverage.
…and adds what both lack: declarative YAML test definitions validated by a JSON Schema, a plugin system (sandboxed WASM components and native libraries), built-in distributed execution with mathematically correct percentile aggregation, and a built-in management web UI.
A taste
name: smoke
defaults:
  http: { base_url: https://api.example.com }

scenarios:
  api:
    executor: constant-arrival-rate
    rate: 100
    duration: 5m
    pre_allocated_vus: 50
    flow:
      - request:
          url: /search?q=widgets
          extract: [ { type: jsonpath, name: first, expression: "$.results[0].id" } ]
          checks: [ { type: status, equals: 200 } ]
      - request: { url: "/items/${first}" }

thresholds:
  http_req_duration: [ "p(95)<300" ]
  http_req_failed: [ "rate<0.01" ]
loadr run smoke.yaml # exit code 0 when thresholds pass, 99 when not
How the pieces fit
| Component | What it does |
|---|---|
loadr run | run a test locally (standalone mode) |
loadr controller + loadr agent | distribute one test across a fleet |
loadr validate | lint a test file with line/column diagnostics |
loadr convert | import JMeter .jmx files and k6 scripts |
loadr report | render an HTML report from saved results |
| Web UI | live dashboards, test editing, fleet management |
| Plugins | new protocols, outputs, extractors, assertions, services |
Continue with Installation, or jump to the YAML reference, the JS API, or the migration guides.
Installation
Release binaries
Download the archive for your platform from the
GitHub releases, unpack
it and put loadr on your PATH:
curl -sSL https://github.com/levantar-ai/loadr/releases/latest/download/loadr-x86_64-unknown-linux-gnu.tar.gz | tar xz
sudo mv loadr-*/loadr /usr/local/bin/
loadr version
Builds are published for Linux (x86_64, aarch64), macOS (Intel & Apple
Silicon) and Windows — each with a SHA256 checksum and SLSA build provenance
you can verify with gh attestation verify.
From source (Cargo)
cargo install --git https://github.com/levantar-ai/loadr loadr-cli
Rust 1.85+ is required. There are no system dependencies — protobuf compilation happens in-process (protox), TLS is rustls, and the JS engine (QuickJS) is compiled in.
Shell completions
loadr completions bash | sudo tee /etc/bash_completion.d/loadr
loadr completions zsh > "${fpath[1]}/_loadr"
loadr completions fish > ~/.config/fish/completions/loadr.fish
Editor support for test files
Generate the JSON Schema once and point your editor at it for autocomplete and inline validation — see JSON Schema & editor setup:
loadr schema > loadr.schema.json
Your first test
Create first.yaml:
name: first-test
defaults:
  http:
    base_url: https://httpbin.org
    timeout: 10s

scenarios:
  smoke:
    executor: constant-vus
    vus: 5
    duration: 30s
    flow:
      - request:
          name: get anything
          url: /anything?hello=loadr
          checks:
            - { type: status, equals: 200 }
            - { type: jsonpath, name: echoed arg, expression: "$.args.hello", equals: loadr }
      - think_time: { type: uniform, min: 500ms, max: 1500ms }

thresholds:
  http_req_duration: [ "p(95)<2000" ]
  checks: [ "rate>0.99" ]
Validate it first — loadr's validator reports precise positions and suggests fixes for typos:
$ loadr validate first.yaml
✓ first.yaml is valid (1 scenario, 1 request)
Run it:
$ loadr run first.yaml

  first-test — 1 scenario(s), 30.0s

  checks.....................: 100.00% — ✓ 214 ✗ 0
    ✓ status is 200 (107 / 107)
    ✓ echoed arg (107 / 107)
  http_req_duration..........: avg=312.44ms min=287.12ms med=305.81ms max=512.20ms p(90)=341ms p(95)=367ms p(99)=489ms
  http_reqs..................: 107 (3/s)
  iterations.................: 107 (3/s)
  vus........................: value=5 min=5 max=5

  thresholds:
    ✓ http_req_duration: p(95)<2000 (observed: 367.21)
    ✓ checks: rate>0.99 (observed: 1.00)
The exit code is 0 when all thresholds pass and 99 when any fail — wire it
straight into CI.
What just happened
constant-vuskept exactly 5 virtual users iterating for 30 seconds — a closed load model (new iterations start only when the previous finishes).- Each iteration ran the
flow: one HTTP request, two checks, then a random pause between 500 ms and 1.5 s. - Checks record pass/fail into the
checksmetric without failing the request (useassert:for failures). The threshold overchecksis what gates the run.
Next steps
- Watch it live:
loadr run --ui first.yamlthen openhttp://127.0.0.1:6464. - Save machine-readable results:
loadr run --summary-export results.json first.yaml. - Browse
examples/— 15 runnable tests covering every feature.
The CLI
loadr <COMMAND>

Commands:
  run          Run a test (standalone, or submit to a controller)
  validate     Validate test files and print diagnostics
  convert      Convert JMeter .jmx or k6 .js files to loadr YAML
  controller   Run the distributed-mode controller
  agent        Run a load-generating agent
  plugin       List, install, enable, disable and inspect plugins
  report       Render an HTML report from a summary JSON file
  schema       Print the JSON Schema for test definitions
  completions  Generate shell completions
  version      Print version information
Global flags: -q/--quiet (errors only), -v/--verbose (repeat for more),
--no-color.
loadr run
loadr run test.yaml                         # run locally
loadr run -e staging test.yaml              # apply the env.staging overrides
loadr run --vus 50 --duration 2m test.yaml  # override single-scenario load
loadr run --ui test.yaml                    # serve the live web UI during the run
loadr run --summary-export out.json test.yaml
loadr run --output json=samples.jsonl test.yaml   # ad-hoc output (repeatable)
loadr run --quiet test.yaml                 # summary only, no live progress
loadr run --controller host:6464 test.yaml  # submit via the controller's API port
| Exit code | Meaning |
|---|---|
| 0 | run finished, all thresholds passed |
| 1 | error (invalid test, I/O, ...) |
| 99 | run finished but thresholds failed (k6-compatible) |
| 130 | interrupted (Ctrl-C twice; first Ctrl-C stops gracefully) |
Selecting scenarios by tag
Tag scenarios in YAML with the scenario-level tags map, then run only the
ones you want with --tags / --exclude-tags. (These same tags are also
attached to the scenario's metric samples.)
scenarios:
  smoke_read:
    executor: shared-iterations
    vus: 2
    iterations: 10
    tags: { suite: smoke, kind: read }     # name → value pairs
    flow: [ { request: { url: /api/v1/items } } ]
  full_write:
    executor: ramping-vus
    stages: [ { duration: 1m, target: 30 } ]
    tags: { suite: full, kind: write }
    flow: [ ... ]
The filter matches against tag values, not the tag names:
--tags a,b— keep a scenario if it carries at least one of these values (any-match / OR). Omit--tagsto start from every scenario.--exclude-tags a,b— drop a scenario if it carries any of these values.- Exclude always wins: a scenario matched by both
--tagsand--exclude-tagsis dropped. - Both flags take a comma-separated list and may be repeated.
- If the filter leaves no scenarios, the run fails with an error rather than running nothing.
loadr run --tags smoke test.yaml                 # only scenarios tagged `smoke`
loadr run --tags read,write test.yaml            # tagged `read` OR `write`
loadr run --tags full --exclude-tags write test.yaml  # full load, reads only
loadr run --exclude-tags smoke test.yaml         # everything except smoke
After filtering, loadr prints how many of the original scenarios remain
(unless --quiet).
loadr validate
$ loadr validate broken.yaml
error at line 12, column 5 (scenarios.api.executor): `constant-arrival-rate` requires `pre_allocated_vus`
error at line 18, column 9 (scenarios.api.flow[0].request.url): `${vars.api_kye}` is not defined under `variables:` — did you mean `api_key`?
2 error(s), 0 warning(s)
--format json emits diagnostics as JSON for editor/CI integration.
loadr convert
loadr convert plan.jmx -o converted.yaml
loadr convert k6-script.js -o converted.yaml
Conversion warnings (unsupported constructs, things to review) print to
stderr; the output always passes loadr validate.
loadr plugin
loadr plugin list                      # discovered plugins + enabled state
loadr plugin install ./my-plugin-dir  # copy into the plugins directory
loadr plugin info my-extractor
loadr plugin disable my-extractor
loadr plugin enable my-extractor
The plugins directory is ~/.loadr/plugins (override with
LOADR_PLUGINS_DIR or --plugins-dir).
loadr report
loadr run --summary-export results.json test.yaml
loadr report results.json -o report.html
Produces a self-contained HTML file: interactive time-series charts
(throughput, latency p50/p95/p99, active VUs, error rate) plus the aggregate
metric tables, latency percentiles, and check and threshold outcomes —
shareable with people who don't run loadr. No network assets; the charts are
inline SVG drawn by a small inline script. See HTML reports
for the chart details and the timeline schema.
Test definition overview
A loadr test is one YAML file. Every top-level key:
name: my-test                # display name (optional)
description: what it does    # free text (optional)

defaults: { ... }            # request defaults: base URL, headers, timeouts, TLS, tags
env: { ... }                 # named environment overlays (-e <name>)
variables: { ... }           # static values: ${vars.name}
secrets: { ... }             # values from env/file: ${secrets.name} (redacted)
data: { ... }                # CSV / inline data sources: ${data.source.column}
metrics: { ... }             # custom metric declarations
js: { ... }                  # embedded JavaScript module + limits

scenarios: { ... }           # REQUIRED: the workloads
thresholds: { ... }          # pass/fail criteria over metrics
outputs: [ ... ]             # exporters: jsonl, csv, prometheus, influxdb, otlp, statsd
plugins: [ ... ]             # plugins to load
Unknown keys are rejected with a did-you-mean suggestion. Durations are
strings like 300ms, 30s, 1m30s, 1h (bare numbers mean seconds).
Defaults
defaults:
  http:
    base_url: https://api.example.com   # joined with relative request URLs
    headers: { User-Agent: loadr/0.1 }
    timeout: 30s                        # per request (default 30s)
    follow_redirects: true              # default true
    max_redirects: 10
    version: auto                       # auto | http1 | http2 | http2-prior-knowledge
    compression: true                   # Accept-Encoding + auto-decompress
    keep_alive: true                    # reuse connections within a VU
    proxy: http://proxy.internal:3128
    cookies: true                       # automatic per-VU cookie jar
    tls:
      insecure_skip_verify: false
      ca_file: ./ca.pem                 # extra trusted roots
      cert_file: ./client.pem           # mTLS client certificate
      key_file: ./client-key.pem
      server_name: override.sni.name
  tags: { team: payments }              # added to every sample
  think_time: { type: uniform, min: 1s, max: 2s }   # default pause after each request
Minimal complete test
scenarios:
  s:
    executor: constant-vus
    vus: 1
    duration: 10s
    flow:
      - request: { url: https://example.com/ }
Everything else is optional. See the following chapters for each block, or
generate the JSON Schema (loadr schema) for the exhaustive picture.
Scenarios & executors
A test has one or more scenarios, all running concurrently (offset with
start_time). Each scenario picks an executor — the algorithm that
schedules iterations. loadr implements all seven k6 executors with identical
semantics.
scenarios:
  my_scenario:
    executor: ramping-vus        # which scheduling model
    # ... executor-specific knobs ...
    start_time: 30s              # delay after test start (default 0)
    graceful_stop: 30s           # time for in-flight iterations to finish (default 30s)
    exec: myJsFunction           # JS function to run per iteration (optional)
    flow: [ ... ]                # declarative steps per iteration (optional; needs flow and/or exec)
    pacing: { iterations_per_second: 10 }   # constant-throughput governor
    think_time: { type: constant, duration: 1s }  # default pause after each request
    tags: { kind: api }          # tags on all samples from this scenario
The scenario tags map (name → value) is attached to every sample from the
scenario, and its values also drive loadr run --tags / --exclude-tags
scenario selection — see Selecting scenarios by tag.
Closed-model executors
New iterations start only when a VU finishes its previous one — throughput depends on response times (a coordinated-omission-prone model; use open models to control offered load).
constant-vus
executor: constant-vus
vus: 50
duration: 5m
ramping-vus
VU count follows linear ramps between stage targets.
executor: ramping-vus
start_vus: 0
stages:
  - { duration: 2m, target: 100 }   # ramp 0 → 100
  - { duration: 5m, target: 100 }   # hold
  - { duration: 1m, target: 0 }     # ramp down
graceful_ramp_down: 30s             # grace for iterations on de-allocated VUs
per-vu-iterations
Each VU runs exactly N iterations.
executor: per-vu-iterations
vus: 10
iterations: 100        # per VU → 1000 total
max_duration: 10m      # safety cap (default 10m)
shared-iterations
A pool of N iterations split dynamically among VUs (fast VUs do more).
executor: shared-iterations
vus: 10
iterations: 1000       # total
max_duration: 10m
Open-model executors
Iterations start on schedule regardless of completion — the offered load
is what you configured, and saturation shows up as dropped_iterations
instead of silently lower request rates.
constant-arrival-rate
executor: constant-arrival-rate
rate: 100              # iteration starts per time_unit
time_unit: 1s          # default 1s (rate: 6000 + time_unit: 1m ≡ 100/s)
duration: 10m
pre_allocated_vus: 50  # workers created up front
max_vus: 200           # pool may grow to this before dropping iterations
ramping-arrival-rate
executor: ramping-arrival-rate
start_rate: 10
time_unit: 1s
pre_allocated_vus: 50
max_vus: 500
stages:
  - { duration: 2m, target: 100 }   # linear rate ramp
  - { duration: 5m, target: 100 }
externally-controlled
VU count is set at runtime — from the web UI's run page, the controller API, or programmatically. Great for exploratory "turn the dial" testing.
executor: externally-controlled
max_vus: 500
duration: 30m          # optional; omit to run until stopped
Graceful stop semantics
When a scenario's schedule ends (or the run is stopped), no new iterations
start; in-flight iterations get graceful_stop (default 30s) to finish before
being cancelled. ramping-vus additionally applies graceful_ramp_down to
VUs being de-allocated mid-iteration during a downward ramp.
Requests
The flow: of a scenario is a list of steps, each a single-key mapping:
request, think_time, js, or group.
flow:
  - request:
      name: create order          # metric tag (defaults to the URL string)
      protocol: http              # inferred from URL scheme when omitted
      method: POST                # default GET (POST when a body is present)
      url: /orders                # absolute, or relative to defaults.http.base_url
      params: { source: loadtest }    # query string parameters
      headers:
        X-Idempotency-Key: "${js: crypto.uuidv4()}"
      body: ...                   # see below
      timeout: 10s                # per-request override
      follow_redirects: false     # per-request override
      tags: { endpoint: orders }  # extra metric tags
      extract: [ ... ]            # see Extraction
      assert: [ ... ]             # failures mark the request failed
      checks: [ ... ]             # recorded only
  - think_time: { type: uniform, min: 1s, max: 3s }
  - js: "session.counterAdd('orders_created', 1)"
  - group:
      name: checkout              # nested samples get group="::checkout"
      steps: [ ... ]
Bodies
body: 'raw string with ${interpolation}'
# or structured (exactly one key):
body: { json: { sku: "W-1", qty: 2, note: "${vars.note}" } }   # sets Content-Type
body: { file: ./payload.bin }                                  # loaded at start
body: { form: { user: alice, pass: "${secrets.pw}" } }         # urlencoded
body:
  multipart:
    - { name: meta, value: '{"kind":"avatar"}', content_type: application/json }
    - { name: file, file: ./avatar.png, filename: avatar.png }
JSON bodies interpolate every string leaf; a leaf that is only ${expr}
keeps its JSON type when the value parses as JSON ("${count}" → 7, not
"7").
Protocol-specific blocks
Non-HTTP requests use the same step with an extra options block — see the protocol chapters:
- request: { url: wss://x/ws, ws: { send: ["hi"], receive_count: 1 } }
- request: { url: grpc://x:50051, grpc: { service: pkg.Svc, method: M, reflection: true, message: {...} } }
- request: { url: /graphql, protocol: graphql, graphql: { query: "...", variables: {...} } }
- request: { url: tcp://x:7000, socket: { send_text: "PING\n", read_bytes: 64 } }
- request: { url: postgres://u:p@db/app, sql: { query: "SELECT * FROM t WHERE id=$1", params: ["1"] } }  # needs the PostgreSQL plugin
SQL is delivered as native protocol plugins, not built in: install the PostgreSQL plugin (
loadr plugin install postgres, advisory-clean) or the MySQL plugin (loadr plugin install mysql) and list it underplugins:. Thesql:block above is the same once the relevant plugin is installed ($1, $2, …placeholders for PostgreSQL,?for MySQL).
Cookies
With defaults.http.cookies: true (the default) every VU has its own cookie
jar: Set-Cookie responses are stored (RFC 6265 domain/path/secure/expiry
matching) and sent automatically. Manual control is available from JS:
session.cookieSet(url, name, value), session.cookieGet(url, name),
session.cookiesClear().
Flow control
Beyond a straight sequence of steps, a flow can loop, branch and choose at
random — covering Gatling's repeat/during/asLongAs/doIf/randomSwitch
and Locust's weighted-task model in declarative YAML.
repeat — a fixed number of times
flow:
  - repeat:
      times: 3
      counter: attempt          # 0-based loop index, readable from JS (default `index`)
      steps:
        - request: { url: /poll }
        - think_time: { type: constant, duration: 1s }
while — as long as a condition holds
The condition is a JavaScript expression evaluated in the VU's runtime before
each pass. max_iterations (default 10000) prevents runaway loops.
flow:
  - js: "session.vars.page = 0"
  - while:
      condition: "Number(session.vars.page) < 5"
      max_iterations: 20
      steps:
        - request: { url: "/feed?page=${page}" }
        - js: "session.vars.page = Number(session.vars.page) + 1"
if / else — branch on a condition
flow:
  - if:
      condition: "response && JSON.parse(session.vars.cart||'{}').items > 0"
      then:
        - request: { method: POST, url: /checkout }
      else:
        - request: { url: /cart/empty }
(else is optional.)
random — weighted / uniform / round-robin branches
The headline Locust paradigm (@task(weight)) and Gatling's switches. Each
branch's samples are tagged with the branch name (or branch-<n>).
flow:
  - random:
      strategy: weighted          # weighted (default) | uniform | round_robin
      choices:
        - weight: 70
          name: browse
          steps:
            - request: { url: /search?q=widget }
        - weight: 25
          name: add_to_cart
          steps:
            - request: { method: POST, url: /cart, body: { json: { sku: W-1 } } }
        - weight: 5
          name: checkout
          steps:
            - request: { method: POST, url: /checkout }
| Strategy | Behaviour |
|---|---|
weighted | pick proportional to weight (default 1.0 each) — Gatling randomSwitch, Locust task weights |
uniform | every branch equally likely — Gatling uniformRandomSwitch |
round_robin | cycle through branches in order — Gatling roundRobinSwitch |
Nesting
Control-flow steps nest arbitrarily — a random branch can contain a
while, a repeat can wrap an if, and group still tags everything inside.
This is how you model realistic user journeys: browse 1–5 pages, then with
some probability add to cart, then maybe check out, retrying the payment up to
3 times. See examples/16-flow-control.yaml.
Extraction & correlation
Extractors pull values out of a response into named variables, available to
every later step in the iteration as ${name} and to JS as
session.vars.name.
- request:
    url: /checkout/start
    extract:
      - { type: jsonpath, name: order_id, expression: "$.order.id" }
      - { type: regex,    name: csrf,     expression: 'csrf" value="([^"]+)', group: 1 }
      - { type: xpath,    name: total,    expression: "//order/total" }
      - { type: css,      name: token,    expression: "input[name=token]", attribute: value }
      - { type: boundary, name: trace,    left: 'trace="', right: '"' }
      - { type: header,   name: location, header: Location }
- request:
    url: /orders/${order_id}
    headers: { X-Trace: "${trace}" }
| Type | Source | Notes |
|---|---|---|
jsonpath | JSON body | full JSONPath; result keeps its JSON type |
regex | body text | group selects the capture group (default 1, 0 = whole match) |
xpath | XML body | XPath 1.0 |
css | HTML body | CSS selector; attribute: reads an attribute, otherwise element text |
boundary | body text | JMeter-style left/right boundary |
header | response headers | case-insensitive |
Common options:
default: value— used when nothing matches. Without a default, a failed extraction marks the request failed (http_req_failed) and the variable stays unset.index: first | last | random | all— which match to take (allproduces a JSON array). Supported by jsonpath, regex, css and boundary.
Extracted values are per-VU and per-iteration scoped state — they persist across steps within the iteration and across iterations of the same VU until overwritten.
Fused check-chains
A chain does extract → coerce type → transform → validate → save in one
declarative step (Gatling-style), so you do not have to spread a single value's
handling across an extract: entry, a JS hook and a checks: entry. Chains
appear in the same extract: list as the classic extractors and can be mixed
with them freely.
- request:
    url: /inventory
    extract:
      # The `chain:` key is the variable name to save under.
      - chain: cheapest_name
        jmespath: "items | sort_by(@, &price)[0].name"   # one source
        as: string                                        # optional: coerce
        transform: [trim, uppercase]                      # optional: pipeline
        check:                                            # optional: validate
          not_empty: true
          matches: "^[A-Z]+$"
        default: NONE                                     # optional: fallback
- request:
    url: /items/${cheapest_name}
Source — pick exactly one
A chain reads from one source; the field name is the source type:
| Field | Source | Notes |
|---|---|---|
jmespath | JSON body | JMESPath query/transform language (filters, projections, functions) |
jsonpath | JSON body | full JSONPath; result keeps its JSON type |
regex | body text | group: selects the capture group (default 1) |
header | response headers | case-insensitive header name |
css | HTML body | CSS selector; attribute: reads an attribute, else element text |
xpath | XML body | XPath 1.0 |
left + right | body text | JMeter-style boundary extractor |
index: first | last | random | all chooses which match to take when the
source yields several (all produces a JSON array). For jmespath, index
applies when the query itself returns an array.
as: — coerce the type
Coerce the raw value before transforming/validating it: int, float, bool
or string. Numeric and boolean strings are parsed ("7" → 7, "yes" →
true); bool accepts true/false, 1/0, yes/no, on/off. JSONPath and
JMESPath already keep native JSON types, so as: is mainly for the text-based
sources (regex, header, css, …) or to normalise a stringly value.
transform: — an ordered pipeline
Each transform runs in order and yields a string. String forms take no argument; object forms carry one:
| Transform | Effect |
|---|---|
trim | strip surrounding whitespace |
lowercase / uppercase | change case |
url_encode / url_decode | percent-encoding |
base64_encode / base64_decode | standard base64 |
{ append: "..." } / { prepend: "Bearer " } | concatenate a literal |
{ replace: [from, to] } | replace all occurrences |
{ substring: [start, len] } | character-offset substring (len optional) |
- chain: auth
  header: X-Token
  transform: [trim, { prepend: "Bearer " }]   # "  abc " -> "Bearer abc"
check: — validate before saving
Every set constraint must hold or the chain fails. A failing chain check is
recorded to the checks metric (just like a standalone checks: entry) and
marks the request failed; on_failure: controls flow exactly like an assertion.
| Key | Meaning |
|---|---|
equals | value must equal this (compared after coerce/transform) |
matches | value (as text) must match this regex |
one_of | value must be one of these |
min / max | numeric bounds (inclusive) |
not_empty | value (as text) must be non-empty |
on_failure | continue (default) · abort_iteration · abort_scenario · abort_test |
- chain: order_status
  jsonpath: "$.status"
  transform: [lowercase]
  check:
    one_of: [pending, paid, shipped, delivered]
    on_failure: abort_iteration
  default: pending
default:
As with the classic extractors, default: supplies a value when the source
matches nothing. Without one, a no-match marks the request failed and leaves the
variable unset. The default is still coerced, transformed and validated.
A complete runnable example lives in
examples/25-check-chains.yaml.
Assertions & checks
The same condition types power two blocks with different consequences:
assert:— JMeter-style assertions. A failure marks the request failed (http_req_failed) and can change control flow viaon_failure.checks:— k6-style checks. Results are recorded into thechecksrate metric (per-check, via thechecktag) and never fail the request. Gate the run with a threshold:checks: ["rate>0.99"].
- request:
    url: /orders
    assert:
      - { type: status, equals: 201 }
      - { type: jsonpath, expression: "$.order.id", exists: true, on_failure: abort_iteration }
    checks:
      - { type: duration, name: fast enough, max: 250ms }
      - { type: body_contains, value: '"status":"pending"' }
Condition types
| Type | Fields | Passes when |
|---|---|---|
status | equals, one_of: [..], matches: "2.." | status code matches |
body_contains | value, negate | body contains (or not) the substring |
body_matches | pattern, negate | body matches the regex |
jsonpath | expression, equals, exists | match exists (default) / equals the JSON value |
xpath | expression, equals, exists | XPath 1.0 result |
duration | max | response duration ≤ max |
size | min, max, equals | body size in bounds |
header | header, equals, contains, exists | header present/matching |
js | expression | the JS expression is truthy (response is in scope) |
All take an optional name (used in reports; a sensible one is generated
otherwise) and, in assert: blocks, on_failure:
on_failure | Effect |
|---|---|
continue (default) | record the failure, keep going |
abort_iteration | skip the rest of this iteration |
abort_scenario | stop this scenario |
abort_test | stop the whole run (exit code reflects failure) |
JS conditions
checks:
  - type: js
    name: balanced response
    expression: "response.json ? true : JSON.parse(response.body).items.length > 0"
The response object has status, body, headers (lower-cased),
duration_ms, url, error, protocol.
Validating an extracted value inline
To extract a value and validate it in one step (rather than a separate
extract: and checks:), use a fused check-chain:
its check: block records to the checks metric and respects on_failure just
like the conditions above.
Thresholds
Thresholds are the pass/fail contract of a test, evaluated continuously
during the run and finally at the end. Any failing threshold makes
loadr run exit with code 99 (k6-compatible).
thresholds:
  http_req_duration:
    - "p(95)<400"                    # plain expression
    - threshold: "p(99.9)<1500"      # object form
      abort_on_fail: true            # stop the test the moment it fails...
      delay_abort_eval: 30s          # ...but not in the first 30s (warm-up)
  http_req_failed: [ "rate<0.01" ]
  checks: [ "rate>0.99" ]
  my_custom_counter: [ "count>1000" ]
  "http_req_duration{scenario:api}": [ "p(99)<250" ]   # tag-filtered
Expression syntax
<aggregation> <op> <bound> where op ∈ < <= > >= == !=.
| Aggregation | Applies to | Meaning |
|---|---|---|
avg, min, max, med | trend | statistics in milliseconds |
p(N) | trend | any percentile, e.g. p(95), p(99.9) (HDR-exact) |
rate | rate | pass fraction 0..1; on counters: events/second |
count | counter | total |
value | gauge | last value |
Bounds accept durations for time metrics: p(95)<400ms, avg<1.5s.
Tag selectors
metric{tag:value,tag2:value2} aggregates only samples whose tags include
all listed pairs. Useful tags: scenario, name (request name), method,
status, group, check, plus anything from tags: blocks.
thresholds:
  "http_req_duration{name:checkout}": [ "p(95)<800" ]
  "checks{scenario:browse}": [ "rate>0.95" ]
Semantics worth knowing
- A threshold over a metric with no samples passes (matching k6) — but
loadr validatewarns when the metric name is unknown. abort_on_failtriggers a graceful stop (in-flight iterations finish, summary still produced, exit code 99).- In distributed runs thresholds are evaluated centrally on merged
histograms, so
p(99)is the true fleet-wide percentile.
Data parameterization
Feed iterations from CSV files or inline rows. A row is consumed once per iteration per source (the first reference fetches it; later references in the same iteration see the same row).
data:
  users:
    type: csv
    path: data/users.csv     # relative to the test file
    mode: shared             # shared | per_vu
    on_eof: recycle          # recycle | stop
    delimiter: ","           # default ,
    has_header: true         # default true; otherwise columns are col0, col1, ...
  fixtures:
    type: inline
    rows:
      - { sku: W-1, qty: 1 }
      - { sku: W-2, qty: 3 }

scenarios:
  buy:
    executor: per-vu-iterations
    vus: 5
    iterations: 100
    flow:
      - request:
          method: POST
          url: /cart
          body: { form: { user: "${data.users.username}", sku: "${data.fixtures.sku}" } }
Modes
shared— one cursor for the whole run; VUs pull the next row atomically. Rows are spread across VUs (each row used once per lap).per_vu— every VU iterates the full data set from the top independently.
End of data
recycle— wrap to the first row (default).stop— the VU that hits EOF stops iterating (JMeter's "stop thread on EOF"). With shared mode this winds the test down as the data runs out — handy for "process each row exactly once" jobs.
From JS, fetch the current row with session.data('users') →
{username: "...", password: "..."}.
Feeder strategies & throttling
Two more features borrowed from Gatling: feeder strategies (how rows are chosen) and a throttle (a hard request-rate ceiling).
Pick strategies
Any CSV, JSON or inline data source takes a pick strategy alongside its
mode (shared/per-VU) and on_eof (recycle/stop):
data:
  users:
    type: csv
    path: data/users.csv
    mode: per_vu
    pick: shuffle       # sequential (default) | random | shuffle
    on_eof: recycle
pick | Behaviour |
|---|---|
sequential | rows in file order; the cursor advances by one (default) — Gatling circular |
random | a uniformly random row every time; never exhausts (on_eof ignored) — Gatling random |
shuffle | the full set shuffled once per VU, then read in that order — Gatling shuffle |
JSON feeders
Besides CSV and inline rows, a data source can be a JSON file — an array of objects, each object a row:
data:
  skus:
    type: json
    path: data/skus.json    # [ { "sku": "W-1", "name": "Widget" }, ... ]
    pick: random
Reference fields the same way: ${data.skus.sku}.
Throttling (request-rate ceiling)
A scenario can cap its aggregate request rate regardless of how many VUs are
running or how fast the target responds — Gatling's throttle /
reachRps(...). Iterations block before each request until a slot frees up
(a global token-bucket limiter shared across all the scenario's VUs).
scenarios:
  steady:
    executor: constant-vus
    vus: 50
    duration: 10m
    throttle: { requests_per_second: 200 }   # never exceed 200 req/s in total
    flow:
      - request: { url: /api/items }
This is distinct from the arrival-rate executors (which control iteration
starts) and from pacing (which spaces iterations): throttle is a ceiling on
requests that applies on top of whatever executor you choose. Use it to stay
under a known rate limit, or to hold a flat load while a closed model would
otherwise overshoot.
See examples/17-feeders-and-throttle.yaml.
Variables, secrets & interpolation
${...} placeholders work in URLs, headers, params, bodies (string leaves),
request names, WebSocket frames, gRPC messages and GraphQL variables.
| Form | Resolves to |
|---|---|
${env.NAME} | process environment variable |
${vars.name} | the variables: block |
${secrets.name} | the secrets: block (redacted from logs/reports) |
${data.source.column} | current data row |
${name} | extracted variable / JS-set session.vars.name |
${vu} / ${iteration} / ${scenario} | the running VU id / iteration index / scenario name |
${js: expr} | evaluate JS in the VU's runtime, e.g. ${js: Date.now()} |
Escape a literal with $${ → ${.
variables:
  tenant: acme
  api_base: "https://${env.REGION}.api.example.com"   # env resolved at startup

secrets:
  api_key: { env: API_KEY }          # from the environment
  db_pass: { file: ./secrets/db }    # from a file (trimmed)

scenarios:
  s:
    executor: constant-vus
    vus: 1
    duration: 1m
    flow:
      - request:
          url: /tenants/${vars.tenant}/ping
          headers:
            X-Api-Key: ${secrets.api_key}
            X-Request-Id: "${js: crypto.uuidv4()}"
Notes:
variablesvalues may interpolate${env.*}— resolved once at startup. Other namespaces resolve per use, inside the iteration.- Secrets never appear in console output, summaries or validation messages.
loadr validateerrors on${vars.*}/${secrets.*}/${data.*}references that don't exist (with did-you-mean), and warns on bare names no extractor produces.
Think time & pacing
Think time (JMeter-style timers)
A pause, either as an explicit step or as a default after every request:
flow:
  - request: { url: / }
  - think_time: { type: constant, duration: 2s }
  - request: { url: /next }
| Type | Fields | Behaviour |
|---|---|---|
constant | duration | fixed pause |
uniform | min, max | uniformly random in [min, max] |
gaussian | mean, std_dev | normal distribution, truncated at 0 |
Scenario- or test-wide default (applied after each request step):
defaults:
  think_time: { type: uniform, min: 1s, max: 3s }
scenarios:
  fast_api:
    think_time: { type: constant, duration: 100ms }   # overrides the default
Pacing (constant throughput)
The JMeter "constant throughput timer" equivalent: space iteration starts so the scenario approaches a target rate, with VUs as the concurrency ceiling.
scenarios:
  steady:
    executor: constant-vus
    vus: 20
    duration: 10m
    pacing: { iterations_per_second: 10 }   # ~10 iterations/s across all 20 VUs
    flow: [ { request: { url: / } } ]
Prefer the arrival-rate executors when you need precise offered load; pacing is the right tool when porting JMeter plans or when you want a closed model with an upper rate bound.
Outputs
Outputs stream metrics out of a run — raw samples and/or one-second aggregates. Configure any number:
outputs:
  - { type: json, path: results.jsonl }             # newline-delimited JSON
  - { type: csv, path: samples.csv }
  - type: prometheus
    listen: 127.0.0.1:9091                          # scrape endpoint (GET /metrics)
    remote_write_url: http://prom:9090/api/v1/write # and/or push
    interval: 5s
  - type: influxdb
    url: http://influxdb:8086
    database: loadr                                  # bucket (v2) / db (v1)
    token: ${env.INFLUX_TOKEN}
    organization: my-org
  - type: otlp
    endpoint: http://otel-collector:4317
    protocol: grpc                                   # grpc | http
    headers: { x-tenant: load }
  - { type: statsd, address: 127.0.0.1:8125, prefix: loadr. }
  - { type: plugin, name: my-exporter, config: { mode: fast } }
Or ad hoc from the CLI: loadr run --output json=results.jsonl test.yaml.
| Output | Granularity | Notes |
|---|---|---|
json | every sample + snapshots + final summary | one JSON object per line (type field discriminates) |
csv | every sample | timestamp_ms,metric,kind,value,tags |
prometheus | 1 s aggregates | metrics prefixed loadr_; trends as quantile gauges; counters as _total |
influxdb | interval aggregates | line protocol, v1 and v2 APIs |
otlp | interval aggregates | OpenTelemetry metrics over gRPC or HTTP/protobuf |
statsd | every sample | DogStatsD-style tags |
plugin | both | any installed output plugin |
The Grafana dashboard in
deploy/grafana/dashboards/
is pre-built against the Prometheus naming; docker compose -f deploy/docker-compose.yml up gives you the full Prometheus + Grafana stack.
For end-of-run results in CI, prefer --summary-export results.json +
loadr report results.json -o report.html.
Environments
One test file, many targets. The env: block holds named overlays that
deep-merge over the document when selected with -e:
defaults:
  http: { base_url: https://prod.example.com, timeout: 10s }

env:
  staging:
    defaults:
      http:
        base_url: https://staging.example.com    # only this key changes
        tls: { insecure_skip_verify: true }
  ci:
    scenarios:
      api: { vus: 1, duration: 10s }             # tiny load in CI
    thresholds:
      http_req_duration: [ "p(95)<5000" ]        # lax CI thresholds

scenarios:
  api:
    executor: constant-vus
    vus: 20
    duration: 5m
    flow: [ { request: { url: /health } } ]
loadr run test.yaml               # production values
loadr run -e staging test.yaml    # staging overlay
loadr run -e ci test.yaml         # CI overlay
Merge rules:
- Mappings merge recursively — you only write the keys that differ.
- Scalars and lists replace — an overlay
outputs:list replaces the base list entirely. - The
env:block itself is removed before the merge (overlays can't nest). - Unknown
-enames fail fast, listing the available environments.
Combine with ${env.*} interpolation and secrets: for values that differ
per machine rather than per environment.
Embedded JavaScript overview
loadr embeds a JavaScript engine (QuickJS) so dynamic logic lives next to the declarative YAML. JS is usable three ways:
1. Inline expressions
Anywhere ${...} works, ${js: <expr>} evaluates in the VU's runtime:
headers:
  X-Request-Id: "${js: crypto.uuidv4()}"
params:
  page: "${js: Math.ceil(Math.random() * 10)}"
2. Inline script steps
flow:
  - js: "session.counterAdd('pages_viewed', 1)"
  - js:
      script: |
        const row = session.data('users');
        session.vars.greeting = `hello ${row.username}`;
  - js:
      call: warmCache        # an exported function from the module
3. A module (inline or file)
js:
  file: ./script.js          # or  script: |  (inline source)
  timeout: 10s               # per-call wall-clock limit (default 10s)
  memory_limit_mb: 64        # per-VU heap limit (default 64)
The module is an ES module with k6-compatible imports:
import http from 'k6/http';
import { check, sleep, group } from 'k6';
import { Counter, Trend } from 'k6/metrics';

export function setup() { /* once, before VUs start */ return {...}; }
export default function (data) { /* per iteration when exec/default used */ }
export function teardown(data) { /* once, after the run */ }
export function beforeRequest(req) { /* around every YAML request */ return req; }
export function afterRequest(res) { /* ... */ }
Isolation & limits
Every VU gets its own JS runtime and context — no shared mutable state between VUs (matching k6). Each runtime enforces:
- a heap limit (
memory_limit_mb) — exceeding it throws; - a wall-clock interrupt per call (
timeout) — infinite loops are killed; - no filesystem or network access except through the provided APIs
(
open()is restricted to the test's directory).
Values flow both ways
- Extracted YAML values appear in JS as
session.vars.<name>. - Values set from JS (
session.vars.x = ...) are usable in YAML as${x}. setup()'s return value is passed to every scenario function and is readable in hooks.
Lifecycle hooks
            ┌──────────┐
            │ setup()  │  once, before any VU; may make requests;
            └────┬─────┘  return value shared (read-only) with all VUs
                 │
   ┌─────────────┴──────────────┐
   │ per iteration, per VU:     │
   │   flow steps               │   beforeRequest(req) ─▶ request ─▶ afterRequest(res)
   │   then exec function       │   (around every YAML request step)
   └─────────────┬──────────────┘
                 │
            ┌────┴──────┐
            │ teardown()│  once, after the run (even on abort)
            └───────────┘
setup() / teardown(data)
export function setup() {
  const res = http.post('/auth/token', JSON.stringify({ id: __ENV.CLIENT_ID }));
  return { token: res.json().token };          // must be JSON-serializable
}
export function teardown(data) {
  http.post('/auth/revoke', JSON.stringify({ token: data.token }));
}
Scenario functions
A scenario runs its YAML flow first (if any), then its exec function
(default export when exec: default):
scenarios:
  scripted: { executor: constant-vus, vus: 10, duration: 5m, exec: buyFlow }
export function buyFlow(data, ctx) {
  // data = setup() result; ctx = { vu, iteration, scenario }
  const res = http.get('/items', { headers: { Authorization: `Bearer ${data.token}` } });
  check(res, { 'ok': (r) => r.status === 200 });
  sleep(1);
}
beforeRequest(req) / afterRequest(res)
Fire around every YAML request: step (not around http.* calls made
from JS). beforeRequest may mutate and return the request:
export function beforeRequest(req) {
  req.headers['X-Signature'] = crypto.hmac('sha256', __ENV.SIGNING_KEY, req.body || '', 'hex');
  return req;       // returning nothing keeps the request unchanged
}

export function afterRequest(res) {
  if (res.status === 429) console.warn(`rate limited on ${res.url}`);
}
The req object: {name, method, url, headers, body} — url, method,
headers and body may be overridden by the returned object.
Per-VU on_start / on_stop
A scenario can name an exported function to run once per VU, around that
VU's stream of iterations (Locust's on_start / on_stop):
on_startruns once, just before the VU's first iteration.on_stopruns once, when the VU retires (after its last iteration). It is skipped for a VU that never ran an iteration.
Use them for per-user setup and cleanup that should happen once per virtual
user rather than once per iteration — e.g. log in on start, log out on stop.
Both receive the setup() result as their single argument:
scenarios:
  users:
    executor: constant-vus
    vus: 50
    duration: 5m
    on_start: login        # exported from the JS module
    on_stop: logout
    exec: browse
export function login(data) {
  const res = http.post('/auth/login', JSON.stringify({ pw: __ENV.PW }));
  // Stash per-VU state on the VU's session for later iterations.
  session.vars.token = res.json().token;
}

export function browse(data) {
  http.get('/feed', { headers: { Authorization: `Bearer ${session.vars.token}` } });
}

export function logout(data) {
  http.post('/auth/logout', JSON.stringify({ token: session.vars.token }));
}
on_start runs per VU (so once per simulated user), whereas setup() runs
once for the whole test. A failing on_start / on_stop is logged as a
warning and does not abort the run.
handleSummary(data)
Export handleSummary to produce a custom end-of-run report. It runs once,
after teardown(), with the run summary as its single argument. If it returns
a string, that string replaces the default console summary; returning nothing
(or null) leaves the default summary in place. This matches k6's
handleSummary.
export function handleSummary(data) {
  const reqs = data.metrics.find((m) => m.metric === 'http_reqs');
  const dur  = data.metrics.find((m) => m.metric === 'http_req_duration');
  return [
    `run ${data.run_id} — ${data.duration_secs.toFixed(1)}s`,
    `requests: ${reqs ? reqs.agg.sum : 0}`,
    `p95 latency: ${dur ? dur.agg.p95.toFixed(1) : 0} ms`,
    `thresholds passed: ${data.thresholds_passed}`,
  ].join('\n');
}
data is the run summary (the same object written by the JSON output):
{
  name, run_id,
  started_ms, ended_ms, duration_secs,
  scenarios: ['users', ...],            // scenario names
  metrics: [ { metric, kind, agg: { avg, min, med, max, p90, p95, p99,
                                    sum, count, rate, per_second, last } }, ... ],
  checks:  [ { name, passes, fails }, ... ],
  thresholds: [ ... ],
  thresholds_passed: true,
  aborted: null,                        // abort reason, if any
}
Non-string return values are pretty-printed as JSON and used as the report.
JS API reference
All globals are also importable k6-style: import http from 'k6/http',
import { check, sleep, group } from 'k6',
import { Counter, Gauge, Rate, Trend } from 'k6/metrics'.
http
http.get(url, params?)
http.post(url, body?, params?)        // also put, patch, del, head, options
http.request(method, url, body?, params?)
body: string, or object (serialized as JSON withContent-Type: application/json).params:{ headers: {}, timeout: 5000 /* ms */, tags: {}, name: 'metric name' }.- Relative URLs join
defaults.http.base_url. Requests use the VU's cookie jar, connection pool and TLS settings, and emit the fullhttp_*metric family.
Response object:
{
  status: 200, status_text: 'OK',
  body: '...',            // string
  json(),                 // parsed body (or null)
  headers: { 'content-type': '...' },   // lower-cased keys
  duration_ms: 87.2,
  timings: { dns_ms, connect_ms, tls_ms, sending_ms, waiting_ms, receiving_ms, duration_ms, blocked_ms },
  error: null,            // transport error string, if any
  url: 'https://...',     // final URL after redirects
  protocol: 'HTTP/2'
}
check(value, conditions, tags?)
check(res, {
  'status 200': (r) => r.status === 200,
  'fast': (r) => r.duration_ms < 200,
  'flag set': someBoolean,
});
Each key records a pass/fail sample into the checks metric (tag
check=<key>). Returns true when all passed. Never throws.
sleep(seconds) and group(name, fn)
sleep(1.5);
group('checkout', () => { http.post('/cart', ...); });
Groups nest; samples inside carry group="::checkout" tags.
Metrics
const errors = new Counter('business_errors');
const queue = new Gauge('queue_depth');
const hits = new Rate('cache_hits');
const renderTime = new Trend('render_time');

errors.add(1);
queue.add(42);
hits.add(true);                       // or 1/0
renderTime.add(16.6, { page: 'home' });   // value + extra tags
Metrics are registered on first use (or declare them in YAML metrics: to
use them in thresholds with validation).
session — the VU bridge
session.vu              // VU id (number)
session.iteration       // current iteration (0-based)
session.scenario        // scenario name
session.vars.foo        // shared variable store: ${foo} in YAML sees this
session.vars.foo = 'x'
session.data('users')   // current data row for a source: {col: value}
session.cookieGet(url, name)
session.cookieSet(url, name, value)
session.cookiesClear()
// conveniences for YAML one-liners:
session.counterAdd(name, value, tags?)
session.gaugeSet(name, value, tags?)
session.rateAdd(name, pass, tags?)
session.trendAdd(name, value, tags?)
crypto
crypto.sha256('data', 'hex')       // or 'base64'
crypto.sha1('data', 'hex')
crypto.md5('data', 'hex')
crypto.hmac('sha256', 'secret', 'data', 'hex')
crypto.randomBytes(16)             // array of bytes
crypto.uuidv4()                    // string
encoding
encoding.b64encode('hello')        // 'aGVsbG8='
encoding.b64decode('aGVsbG8=')     // 'hello'
Environment & files
__ENV.MY_VAR                       // process environment (string | undefined)
open('./payload.json')             // file contents as string
open('./blob.bin', 'b')            // as bytes
open() resolves relative to the test file's directory and refuses to read
outside it.
console
console.log/info/warn/error/debug route into loadr's structured logging
(visible with -v, in the web UI log view, and in agent logs).
HTTP
The HTTP client is built directly on hyper with a custom connection layer so every phase of every request is measured — no averaged guesses:
| Metric | Phase |
|---|---|
http_req_blocked | waiting for a connection (dns + connect + tls on cold connections; ~0 on reuse) |
http_req_connecting | TCP connect |
http_req_tls_handshaking | TLS handshake |
http_req_sending | writing the request |
http_req_waiting | time to first byte (TTFB) |
http_req_receiving | reading the body |
http_req_duration | sending + waiting + receiving |
Plus http_reqs, http_req_failed (transport error or status ≥ 400),
data_sent, data_received. Samples carry name, method, status,
scenario, group, proto tags.
Versions
defaults.http.version:
auto(default) — ALPN negotiation; HTTP/2 when the server offers it.http1— force HTTP/1.1.http2— offer only h2 over TLS.http2-prior-knowledge— HTTP/2 without negotiation, including plaintext.
HTTP/2 connections are multiplexed; HTTP/1.1 connections are kept alive and
reused per VU (a VU models one user agent: its own connections and cookie
jar). keep_alive: false closes after each request.
TLS & mTLS
defaults:
  http:
    tls:
      ca_file: ./internal-ca.pem        # extra trust roots (PEM, may contain several)
      cert_file: ./client.pem           # client certificate (mTLS)
      key_file: ./client-key.pem
      server_name: api.internal         # SNI override
      insecure_skip_verify: false       # accept any cert (testing only!)
      min_version: "1.2"                # pin the lowest TLS version offered
      max_version: "1.3"                # pin the highest TLS version offered
Roots default to the bundled Mozilla store (webpki-roots). Everything is rustls — no OpenSSL dependency.
TLS version pinning
tls.min_version and tls.max_version constrain which TLS versions the
handshake may negotiate. Both are strings and accept only "1.2" or "1.3"
(the 1. prefix and a TLSv1. prefix are both tolerated, so "TLSv1.3"
works too). When neither is set the client offers TLS 1.2 and 1.3 and lets the
server pick the highest.
defaults:
  http:
    tls:
      min_version: "1.3"     # refuse anything older than TLS 1.3
Pinning is useful for proving a server has dropped legacy TLS, or for forcing a
specific version while profiling. A configuration whose min_version is higher
than its max_version (so no version remains) is rejected at startup.
Redirects, compression, proxies
- Redirects followed by default (
max_redirects: 10); 301/302/303 switch to GET, 307/308 preserve method and body. Timings accumulate across hops; the reportedurlis the final one. compression: truesendsAccept-Encoding: gzip, deflate, brand transparently decompresses.data_receivedcounts wire (compressed) bytes.proxy: http://host:3128routes plaintext requests via absolute-form and HTTPS viaCONNECT.
Cookies
Automatic per-VU jars (RFC 6265 domain/path/secure/expiry matching) — see Requests.
Response caching
cache: true gives each VU a browser-style HTTP cache, modelled on JMeter's
HTTP Cache Manager. Only GET requests are cached, and only when the response
says so:
defaults:
  http:
    cache: true
The cache key is the full request URL. Behaviour per GET:
- Fresh hit — if a stored entry is still within its
max-age, it is served straight from cache with no network round trip. Timings are zero andbytes_sentis0. - Revalidation — if an entry has expired but carries a validator (
ETagand/orLast-Modified), loadr re-requests it withIf-None-Match/If-Modified-Since. A304 Not Modifiedserves the cached body and refreshes its freshness window; the response timings/bytes reflect the conditional request. - Store — a
200 OKwhoseCache-Controlallows caching (amax-age=Nand nono-store/private) is stored for next time.
Cache-Control: no-store or private are never cached. Responses without a
max-age are not stored. The cache lives in the VU and is not shared between
VUs, so the first iteration of each VU populates it.
Each served response carries a cache field in its extras set to hit,
revalidated, or miss, which is handy when inspecting traffic with
--http-debug.
Per-host connection overrides
hosts pins one or more hostnames to fixed addresses, bypassing DNS — the
equivalent of curl's --resolve or k6's options.hosts. Use it to send
traffic at a specific node behind a load balancer, to test before DNS has
propagated, or to hit a staging box while keeping the real Host header.
defaults:
  http:
    hosts:
      api.example.com: 10.0.0.42          # host          -> ip
      api.example.com:443: 10.0.0.42:8443 # host:port      -> ip:port
      cdn.example.com: 10.0.0.43:8080     # host          -> ip:port
Keys are matched case-insensitively. A host:port key matches only requests to
that exact port; a bare host key matches any port. When the mapped value omits
a port, the request's original port is kept. Only connection routing changes —
the URL, Host header, SNI and certificate validation all still use the
original hostname.
Discarding response bodies
discard_response_bodies: true drops each response body as soon as it has been
read and measured. This keeps memory flat during high-throughput or long
soak runs where bodies would otherwise pile up.
defaults:
  http:
    discard_response_bodies: true
Discarding happens after the body is fully received and decompressed, so
data_received and all phase timings stay accurate. Extractors and body
assertions that run on a discarded response see an empty body, so only enable
this when you are asserting on status/headers/timings rather than body content.
Distributed tracing
tracing: true injects a W3C Trace Context traceparent header on every
request, so spans generated by loadr correlate with traces in
your backend (Jaeger, Tempo, Honeycomb, ...) — like k6's tracing.
defaults:
  http:
    tracing: true
A fresh traceparent (00-<32-hex trace-id>-<16-hex span-id>-01) is generated
per request. The trace ids only need to be unique, not cryptographically
random, so they are produced from a fast per-VU PRNG. If a request already
carries a traceparent header (set on the request or in defaults.http.headers),
loadr leaves it untouched.
Wire-level debugging
For a verbose dump of every HTTP request and response — request line, all headers, and a preview of the response body (first 2000 chars) — enable HTTP debug. This is for diagnosing a single test interactively, not for load runs.
loadr run test.yaml --http-debug
The --http-debug flag sets the LOADR_HTTP_DEBUG environment variable, which
the HTTP handler reads on startup; setting LOADR_HTTP_DEBUG directly has the
same effect:
LOADR_HTTP_DEBUG=1 loadr run test.yaml
Output is logged under the loadr::http_debug target. Combined with
cache: true, the logged responses also show the cache state (hit /
revalidated / miss) for each GET.
WebSocket
A request with a ws:///wss:// URL (or protocol: ws) opens a WebSocket
session: connect → send frames → receive until a condition → close.
- request:
    name: chat session
    url: wss://chat.example.com/ws
    headers: { Origin: https://chat.example.com }   # handshake headers
    ws:
      subprotocols: [ "chat.v2" ]
      send:
        - '{"type":"hello"}'                          # text frame
        - { text: '{"type":"msg","body":"hi ${vu}"}', delay: 500ms }
        - { binary_base64: "3q2+7w==", delay: 100ms } # binary frame
      receive_count: 2          # close after N received messages
      receive_until: '"done"'   # ...or when a text message contains this
      session_duration: 10s     # ...or after this long (request timeout still caps everything)
    checks:
      - { type: body_contains, value: '"type":"ack"' }   # runs on the LAST received message
Default receive behaviour (when neither receive_count nor receive_until
is set): wait for one message per sent frame.
Metrics
| Metric | Meaning |
|---|---|
ws_connecting | TCP + TLS + upgrade handshake time |
ws_session_duration | open → close |
ws_msgs_sent / ws_msgs_received | frame counters |
data_sent / data_received | payload bytes |
Extraction and conditions operate on the last received message as the
response body; extras exposes msgs_sent, msgs_received and
last_message for js conditions.
wss:// uses the same TLS configuration as HTTP (custom CAs, mTLS,
insecure_skip_verify).
Server-Sent Events
A request with an sse:///sses:// URL opens a one-way Server-Sent Events
stream: connect → GET with Accept: text/event-stream → read events
frame-by-frame until a stop condition → close.
- request:
    name: order updates
    url: sse://events.example.com/orders/stream
    headers:
      Authorization: Bearer ${token}        # sent on the GET handshake
      Last-Event-ID: "${cursor}"
    checks:
      - { type: body_contains, value: '"status":"shipped"' }   # runs on the LAST event's data
The handler always issues a GET (any other method is an error) and adds
Accept: text/event-stream, Cache-Control: no-cache and
Connection: keep-alive for you. Caller headers and the VU's cookie jar are
merged in. sse:// maps to http://; sses:// maps to https:// and uses the
same TLS configuration as HTTP (custom CAs, mTLS, insecure_skip_verify,
server_name).
Wire format
The stream is parsed per the SSE spec: event:, data:, id: and retry:
fields are accumulated and an event is dispatched on each blank line. Multiple
data: lines are joined with \n; a missing event: defaults to message;
comment lines (starting with :) are ignored; retry: is recognised but not
acted upon (reads are single-shot). A leading space after the field colon is
stripped, and both \n and \r\n line endings are handled.
Stop conditions
By default the stream is read until the server closes it or the request
timeout elapses. Three limits bound the read (whichever is hit first wins, and
the request timeout always caps everything):
| Option | Meaning |
|---|---|
events | Stop after this many events have been dispatched. |
until | Stop on the first event whose data contains this substring. |
duration | Stop after this wall-clock window (e.g. 10s, 500ms, 2m, or a bare number of seconds). |
Metrics
| Metric | Meaning |
|---|---|
plugin_reqs | Count of completed SSE requests |
plugin_req_duration | send + wait (TTFB) + receive time |
data_sent / data_received | request bytes / streamed event bytes |
http_req_failed | failure rate (transport error or stream read error) |
Samples are tagged proto=sse alongside the usual name, method and
status. The reported status is the HTTP status of the stream response (e.g.
200); a connection or handshake failure reports status 0 with an error.
Extraction, checks and assertions
The data of the last received event becomes the response body, so every
extractor and condition (body_contains, body_matches, regex, size,
status, header…) operates on it. A js condition sees the response as
response with status, status_text, body, headers, duration_ms,
error, url and protocol in scope.
checks:
  - { type: body_contains, name: shipped, value: '"status":"shipped"' }
assert:
  - { type: status, equals: 200 }
  - { type: js, expression: 'response.body.length > 0' }
checks are recorded to the checks metric and never fail the request;
assert failures mark the request failed.
Beyond the response body, the handler also reports events_received,
last_event ({ "type", "data", "id" }) and the parsed events (capped at the
first 100) as protocol extras, which surface in run reports.
gRPC
loadr calls gRPC services dynamically — no code generation, no protoc
binary. Describe the service either with .proto files (compiled in-process
by protox) or via server reflection.
- request:
    name: say hello
    url: grpc://greeter.example.com:50051       # grpcs:// for TLS
    grpc:
      proto_files: [ protos/helloworld.proto ]  # relative to the test file
      proto_includes: [ protos/ ]               # import search paths
      service: helloworld.Greeter
      method: SayHello
      message: { name: "vu-${vu}" }             # request message as JSON
      metadata: { x-api-key: "${secrets.key}" }
    assert:
      - { type: status, equals: 0 }             # gRPC code: 0 = OK
      - { type: jsonpath, expression: "$.message", exists: true }
With reflection instead of files:
grpc:
  reflection: true
  service: helloworld.Greeter
  method: SayHello
  message: { name: "world" }
Streaming
All four shapes are supported. Streaming requests provide messages
(a list) instead of message:
grpc:
  reflection: true
  service: helloworld.Greeter
  method: LotsOfReplies          # server streaming: responses collected
  message: { name: "stream" }
---
grpc:
  service: pkg.Ingest
  method: Push                   # client streaming
  messages: [ { v: 1 }, { v: 2 }, { v: 3 } ]
The response body is the (last) response message rendered as JSON, so
jsonpath extraction/assertions work naturally. extras.messages holds
every streamed response; extras.message_count the count.
Semantics & metrics
statusis the gRPC status code (0 = OK); non-zero marks the request failed.status_textcarries the code name and message.- Metrics:
grpc_reqs,grpc_req_duration, plusdata_sent/data_received. - Channels are pooled per VU per endpoint; proto descriptor pools are compiled once and cached process-wide.
grpcs://uses the standard TLS config (custom CAs, mTLS).
GraphQL
GraphQL rides on the HTTP client (protocol: graphql): loadr builds the
standard {query, variables, operationName} POST envelope, then understands
GraphQL's error semantics on top of HTTP's.
- request:
    name: search
    url: /graphql
    protocol: graphql
    graphql:
      query: |
        query Search($term: String!) {
          products(search: $term) { edges { node { id name } } totalCount }
        }
      variables: { term: "widget" }       # string leaves interpolate ${...}
      operation_name: Search
    extract:
      - { type: jsonpath, name: first_id, expression: "$.data.products.edges[0].node.id" }
    checks:
      - { type: jsonpath, name: no errors, expression: "$.errors", exists: false }
Failure semantics
A GraphQL response is marked failed when:
- the HTTP layer failed (transport error or status ≥ 400), or
- the body has a non-empty
errorsarray and nodata(total failure).
Partial errors (errors alongside data) do not fail the request — assert
on them explicitly if they matter:
assert:
  - { type: jsonpath, expression: "$.errors", exists: false }
Metrics
GraphQL requests emit the full http_* family plus graphql_reqs and
graphql_req_duration, so you can threshold GraphQL separately:
thresholds:
  graphql_req_duration: [ "p(95)<400" ]
extras.graphql_errors carries the error count for js conditions.
Browser
The browser protocol drives a real headless Chrome over the Chrome
DevTools Protocol (CDP). A request navigates the page to a URL, waits for the
load to settle, then reads Navigation Timing and Web Vitals straight out
of the page — so the numbers reflect what a user's browser actually does:
DNS/connect/TLS, time to first byte, the DOMContentLoaded and load events,
first and largest contentful paint, and every subresource the page pulls in.
plugins:
  - name: browser            # register the browser protocol

scenarios:
  homepage:
    executor: constant-vus
    vus: 5
    duration: 1m
    flow:
      - request:
          name: load homepage
          protocol: browser   # required — there is no URL-scheme shorthand
          url: https://example.com
          timeout: 30s        # navigation timeout (default 30s)
          checks:
            - { type: status, equals: 200 }
            - { type: body_contains, value: "</html>" }
When to use it
Use browser when you need real client-side timing — paint metrics,
JavaScript execution, and the cost of all the subresources a page fetches. Use
the protocol-level http client for everything else: it is far
cheaper per request and measures the transport precisely, but it does not render
a page, run scripts, or fetch subresources.
Runtime requirement
A Chrome/Chromium binary must be installed on the runner (the handler launches
/usr/bin/google-chrome with --headless=new --no-sandbox --disable-gpu --disable-dev-shm-usage). Chrome is launched lazily — only on the first
browser request — so tests that never reach a browser step pay nothing.
One Chrome process is shared per run. Each VU gets its own tab, reused across
requests, so navigation within a VU keeps a warm cache and a single browsing
session (a VU models one user). Navigation failures (DNS, connection refused,
aborts) are recorded as a failed sample with status = 0 and an error, not as
a crash; only a timeout aborts the step.
Request shape
| Field | Meaning |
|---|---|
protocol: browser | Required. The browser protocol has no URL-scheme alias, so it must be named explicitly and listed under plugins:. |
url | Absolute URL to navigate to (http:// or https://), passed verbatim to the page. Supports ${...}. |
timeout | Navigation timeout; falls back to defaults.http.timeout, then 30s. |
checks / assert | Run against the navigation: status (the real HTTP status of the main document), body_contains / body_matches (the rendered HTML), duration, etc. |
Only the navigation timeout is taken from defaults.http; other HTTP options
(TLS, redirects, compression, cookies) do not apply to the browser protocol.
Metrics
Browser navigations record into the generic plugin_* metric family, plus the
shared failure and byte counters:
| Metric | Kind | Meaning |
|---|---|---|
plugin_reqs | Counter | navigations |
plugin_req_duration | Trend | full navigation time (ms) |
http_req_failed | Rate | navigation error or status ≥ 400 |
data_received | Counter | bytes transferred for the document + subresources |
The standard sample tags apply (name, method, status, proto = browser,
scenario, group).
Web Vitals & timing extras
Each response carries the captured page metrics in extras, available to js
conditions and JavaScript steps via response.extras:
| Key | Meaning |
|---|---|
fcp_ms | First Contentful Paint (may be null if unavailable) |
lcp_ms | Largest Contentful Paint (captured via PerformanceObserver; may be null) |
dcl_ms | DOMContentLoaded event end |
load_ms | load event end |
resources | number of subresources fetched |
transferred_bytes | total transfer size (document + subresources) |
title | the page's document.title |
The Navigation Timing phases (DNS, connect, TLS, TTFB, receiving, total duration) are mapped onto loadr's standard request timings, so they appear in the trend breakdown alongside other protocols.
TCP & UDP
Raw socket round trips for protocols of your own: connect/bind, send a payload, read a response, measure.
- request:
    name: tcp ping
    url: tcp://gateway.example.com:7000
    socket:
      send_text: "PING ${vu}\r\n"     # UTF-8 payload with interpolation
      read_bytes: 64                  # read exactly N bytes...
      # read_until_close: true        # ...or until the server closes
      read_timeout: 2s                # default: the request timeout
    checks:
      - { type: body_contains, value: PONG }

- request:
    name: udp probe
    url: udp://stats.example.com:8125
    socket:
      send_hex: "deadbeef 0102"       # hex payload (whitespace ignored)
      read_timeout: 500ms             # waits for one datagram; absence = failure
Behaviour:
- TCP — connect (timed), send, then read per the options:
read_bytesfor a fixed length,read_until_closeuntil EOF, or (default) a single read of whatever arrives first. - UDP — bind an ephemeral port,
send_to, then receive one datagram (orread_bytesworth) withinread_timeout.
The received bytes become the response body, so every extractor and condition
(regex, boundary, size, body_matches…) works on binary-ish payloads via
their text forms.
Metrics: tcp_reqs/tcp_req_duration, udp_reqs/udp_req_duration,
data_sent, data_received.
Distributed testing overview
One machine tops out. loadr's distributed mode runs one test across a fleet of agents with a single point of control and — crucially — correct aggregate statistics.
                    ┌──────────────────────────────┐
   loadr run ─────▶ │          controller          │ ◀───── web UI / API
   --controller     │  partitioning · aggregation  │
                    │  thresholds · run lifecycle  │
                    └──────┬───────┬───────┬───────┘
                     gRPC (mTLS)   │       │
                    ┌──────┴─┐ ┌───┴────┐ ┌┴───────┐
                    │ agent-1│ │ agent-2│ │ agent-3│   loadr agent --join ...
                    └────────┘ └────────┘ └────────┘
- The controller accepts agents, distributes test definitions and data files, partitions load, coordinates a synchronized start, aggregates metrics centrally and evaluates thresholds fleet-wide.
- Agents are dumb muscle: they receive an assignment, run their share with the ordinary engine, and stream metric deltas back every second.
Quick start
# 1. control plane (also serves the web UI)
loadr controller --bind 0.0.0.0:7625 --ui-bind 0.0.0.0:6464

# 2. on each load generator
loadr agent --join controller-host:7625 --name agent-$(hostname)

# 3. submit a test (to the controller's API/UI port)
loadr run --controller controller-host:6464 test.yaml
Or the batteries-included stack (controller + 3 agents + Prometheus + Grafana):
docker compose -f deploy/docker-compose.yml up --build
Kubernetes manifests and a Helm chart live in
deploy/ —
helm install loadr deploy/helm/loadr --set agents.replicas=10.
What gets partitioned
| Executor | Split across N agents |
|---|---|
constant-vus, ramping-vus | VU counts (remainder to the lowest indices) |
constant-arrival-rate, ramping-arrival-rate | rates divided exactly (N×rate/N = rate) |
shared-iterations | the iteration pool |
per-vu-iterations | VUs split; iterations-per-VU unchanged |
externally-controlled | scale commands split like VU counts |
Stage timings are identical everywhere — only magnitudes scale — so global ramps are exact. A 2-second start barrier puts every agent on the same clock.
Controller & agents
The coordination protocol
Controller and agents speak loadr.coordination.v1 — a single bidirectional
gRPC stream per agent:
agent ──▶ Register{agent_id, name, protocol_version, cores, labels}
      ◀── Registered{controller_id}
      ◀── Assignment{run_id, plan_yaml, partition i/n, data files}
      ◀── Start{run_id, start_unix_ms}          # synchronized barrier
      ──▶ MetricsBatch{run_id, delta}           # every second
      ──▶ Heartbeat{active_vus, run_state}      # every 2 seconds
      ◀── Control{stop|kill|pause|resume|scale}
      ──▶ RunEvent{started|finished|failed, summary}
The protocol is versioned; an agent with an incompatible
protocol_version is rejected at registration.
TLS / mTLS
loadr controller --bind 0.0.0.0:7625 \
  --tls-cert server.pem --tls-key server-key.pem \
  --tls-client-ca clients-ca.pem          # require client certs (mTLS)

loadr agent --join ctrl:7625 \
  --tls-ca ca.pem \
  --tls-cert agent.pem --tls-key agent-key.pem
Without flags the channel is plaintext — fine on a private network, not on the internet.
Failure handling
- Heartbeats every 2 s; an agent silent past the liveness window (default 6 s) is marked unhealthy.
- Reconnection: agents reconnect with jittered exponential backoff and re-register, resuming their identity.
- Agent loss during a run is policy-driven per submission:
continue(default) — remaining agents keep their share; the lost agent's portion of the load simply stops (the summary notes the reduced fleet).abort— the controller stops the run everywhere.
Data files
CSV files, JS modules, proto files and body files referenced by the test are
shipped inside the assignment and materialized in the agent's working
directory. Paths are sanitized — anything containing .. or absolute paths
is rejected.
Operating notes
- Agents are stateless; scale them with your orchestrator
(
kubectl scale deploy/loadr-agent --replicas=20). - One controller handles many sequential/concurrent runs; each run records its agent set at submission time.
- The web UI on the controller shows the fleet (health, VUs, labels, last heartbeat) and every run's live metrics.
Metric aggregation
The percentile trap
Most homegrown distributed setups report per-node percentiles and average them. That number is wrong — often wildly. If agent A's p99 is 100 ms and agent B's p99 is 1000 ms, the fleet's true p99 is not 550 ms; it depends on the full shape of both distributions.
loadr never averages percentiles:
- Every agent records trend metrics into HDR histograms (3 significant figures, auto-resizing).
- Each second, the agent serializes a delta histogram (HDR V2 encoding) and streams it to the controller.
- The controller merges histograms — a lossless operation — into a central aggregator per (metric, tag set).
- Percentiles, thresholds, the live UI and the final summary are computed from the merged histograms only.
Counters and rates merge as exact sums (passes/total); gauges keep the
most recent value plus min/max envelopes.
This is verified by tests: two in-process agents record disjoint latency ranges (1–1000 ms and 1001–2000 ms); the merged p99 must equal the true p99 of the union (~1980 ms), where naive averaging would claim ~1485 ms.
Tags & per-agent visibility
Every sample an agent emits carries an instance: <agent-name> tag, so the
fleet view can show per-agent breakdowns and you can threshold per instance:
thresholds:
  "http_req_duration{instance:agent-1}": [ "p(95)<500" ]
Threshold evaluation
Thresholds run centrally against the merged data — abort_on_fail
decisions consider fleet-wide reality, then fan stop commands out to every
agent. Local evaluation on agents is disabled in distributed runs to avoid
split-brain aborts.
The management UI
A built-in, RabbitMQ-style management interface — shipped as a first-party service plugin, statically linked into the default binary.
loadr run --ui test.yaml                  # standalone: dashboard for this run
loadr controller --ui-bind 0.0.0.0:6464   # distributed: manage the whole fleet
Default address 127.0.0.1:6464 (loopback unless you bind otherwise —
deliberate security default).
Pages
- Overview — live stat cards (RPS, active VUs, error rate, p95) and streaming charts (request rate, latency percentiles, errors), per-scenario table, threshold pass/fail pills, live check rates, and a failure breakdown panel (see below). Updates once per second over SSE.
- Runs — every run with state and outcome; a run page with live charts,
the threshold table, scenario breakdown, and controls: Stop (graceful),
Kill, Pause/Resume, and a VU dial for
externally-controlledscenarios. Finished runs render the full summary (metric table, checks, thresholds). - Tests — a test library: upload/edit YAML in the browser with
line-numbered editing and one-click Validate (the same diagnostics as
loadr validate, inline), then Run. - Agents — the fleet: health, active VUs, cores, labels, last heartbeat.
- Logs — live tail of engine logs.
Dark mode is the default (there's a toggle; it remembers). No CDNs, no trackers — the entire SPA is embedded in the binary.
Failure breakdown
When a test produces failures, the Failure breakdown panel on the Overview and live Run dashboards groups them by cause so you can see why requests failed, not just how many. Four groups are shown, each row carrying its count and share of the group, with a bar for quick scanning:
- HTTP status — failed responses (4xx/5xx) grouped by status code.
- Transport / error — connection-level failures grouped by a coarse kind
(
timeout,dns,tls,connection_refused,connection_reset,connection,transport) plus prepare/protocol/extraction errors. - Failed checks — each check that failed, by name, with the number of failing evaluations.
- Script exceptions — uncaught exceptions from JS hooks,
execfunctions, andjssteps, grouped by a normalised message (volatile detail such as numbers and quoted strings is collapsed so the same logical error groups together).
High-cardinality groups are capped to the top causes with the remainder folded into an other row.
Downloading the breakdown
Two buttons in the panel header export the current breakdown entirely in the browser — no server round-trip:
- ↓ CSV — a
category,cause,count,share_pctfile (loadr-failures-<timestamp>.csv) ready for spreadsheets or further analysis. - ↓ Report — a self-contained HTML report
(
loadr-failures-<timestamp>.html) you can archive or share.
The breakdown is also available programmatically as the failures object on
the live metrics payload (see the /api/overview and /api/runs/:id/stream
responses).
Authentication
loadr controller --ui-user admin --ui-password s3cret      # HTTP Basic
loadr controller --ui-token "$(openssl rand -hex 24)"      # bearer token(s)
Both may be active at once; SSE/WebSocket connections accept
?token=. Without any auth flags the UI is open — bind it to loopback or put
it behind your proxy.
API
Everything the UI does is a JSON API you can script against:
GET  /api/overview                 GET  /api/runs            POST /api/runs
GET  /api/runs/:id                 GET  /api/runs/:id/summary
GET  /api/runs/:id/stream (SSE)    POST /api/runs/:id/stop|pause|scale
GET  /api/agents                   GET/PUT/DELETE /api/tests[/:name]
POST /api/validate                 GET  /api/logs            GET /healthz
loadr Desktop
loadr Desktop is a cross-platform GUI for composing, managing and running
loadr test plans, with a live monitoring dashboard. It is a front-end over the
loadr CLI, not a re-implementation: the app spawns a bundled, version-pinned
loadr binary for every operation — validation, schema, running, conversion and
plugins — so the GUI and the CLI can never disagree about what a plan means or
what a run produced.
Status: beta. Built with Electron + TypeScript and a React 19 / Vite 6 / Tailwind 4 renderer. Source lives in
desktop/.
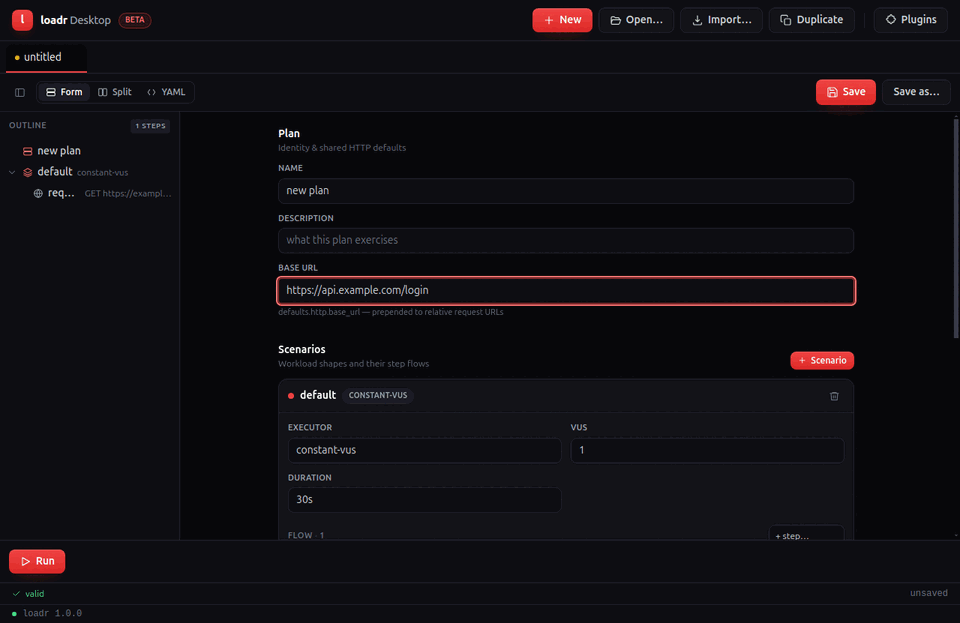
What it does
- Tabbed workspace — one plan per tab, dirty-state markers, New / Open / Import / Duplicate.
- Forms-first composer — a schema-shaped form for the whole plan with a real
editor for every step kind (
request,think_time,js,group,repeat,while,if,foreach,switch,during,retry,parallel,random,rendezvous), including recursive nested-step editors. You never have to drop to YAML to build a plan. - Request assertions, checks & extractors — status/jsonpath/header/duration and the rest of the condition set, plus classic extractors (jsonpath/regex/xpath/css/boundary/header).
- Plan outline — a left-hand tree (Plan → scenarios → flow, recursing through nested steps); click a node to jump to its card.
- Optional YAML view — a
Form / Split / YAMLtoggle backed by Monaco, two-way synced with the forms. Forms-first by default. - Drag-and-drop flow composition, keyboard-accessible (dnd-kit).
- Import JMeter / k6 / HAR via
loadr convert. - Run + live monitoring — a dashboard mirroring the
web UI: live Requests/s, Active VUs, p95 and error tiles, a
streaming throughput chart, threshold pills, a Stop control, plus run
history and run-to-run compare. Every figure comes from the CLI's live
progress stream and
--summary-exporttimeline. - Plugins panel — list / install / remove protocol plugins via
loadr plugin.
How the CLI is bundled
A packaged build is self-contained. At build time
desktop/scripts/stage-loadr.mjs copies the platform-correct loadr binary into
desktop/resources/bin/, and electron-builder ships it via extraResources
(so it lands at <app>/resources/bin/loadr, outside the asar archive and kept
executable). At runtime the app resolves the binary bundled first, then
$LOADR_BIN, then PATH.
Security model
contextIsolationon,nodeIntegrationoff, sandboxed renderer.- The renderer never spawns processes or touches the filesystem; it reaches the main process only through a small, typed, allow-listed preload bridge.
- loadr is spawned with array arguments only — never a shell string — so plan
content can never be interpreted by a shell. Plan content is never
eval'd.
Round-trip guarantee
Opening a .yaml renders the UI; editing it (forms or Monaco) saves YAML that
loadr validate accepts. Property tests prove parse → serialize → parse
preserves the plan over the repo's examples/ corpus, and that a composed plan
covering every step kind validates against the CLI.
Building from source
cd desktop
npm install
npm run dev        # launch (needs a display)
npm test           # unit + round-trip (headless)
npm run package    # stage loadr + electron-builder for this platform
See desktop/README.md
for the full developer guide, CI layout and known environment blockers.
Plugin system overview
loadr extends through five plugin types over two mechanisms — without rebuilding the binary and without a JVM.
| Plugin type | Extends | Typical examples |
|---|---|---|
protocol | new request kinds in flow: | MQTT, Kafka, Redis, database drivers |
output | metric exporters | proprietary APMs, custom data lakes |
extractor | new extract: types | HTML tables, protobuf bodies, JWT claims |
assertion | new condition types | schema validation, image diffing |
service | long-running components | the web UI itself, webhook notifiers |
Two mechanisms
- WASM components (wasmtime, WIT-defined interface) — for
extractors and assertions: portable (one
.wasmruns on every platform), fully sandboxed (no filesystem/network unless granted), written in any language with component tooling. - Native libraries (
abi_stable) — for protocols, outputs and services where raw performance or arbitrary system access matters. Layout-checked at load time: an ABI-incompatible plugin fails loudly with a useful error, not undefined behaviour. Native plugins are normally written in Rust.
Native plugins do not have to be Rust. A small, frozen
plain C ABI lets you write a protocol plugin in C, Go, Zig, or
any language that emits a C shared library — loadr auto-detects which ABI a
library exports at load time, so both kinds coexist transparently.
Installing & using
loadr plugin list
loadr plugin install ./uppercase-extractor/   # dir with plugin.toml + artifact
loadr plugin info uppercase-extractor
loadr plugin disable uppercase-extractor
Plugins live in ~/.loadr/plugins/<name>/ (override:
LOADR_PLUGINS_DIR or --plugins-dir), each with a manifest:
# plugin.toml
[plugin]
name = "uppercase-extractor"
version = "0.1.0"
kind = "extractor"            # protocol | output | extractor | assertion | service
type = "wasm"                 # wasm | native
entry = "uppercase.wasm"
description = "Boundary extractor that upper-cases the match"
Reference plugins from a test:
plugins:
  - { name: uppercase-extractor, config: { left: "id=", right: ";" } }
  - { name: kafka-protocol, path: ./libkafka_protocol.so }   # explicit path

scenarios:
  s:
    flow:
      - request:
          protocol: kafka-protocol          # protocol plugins by name
          url: kafka://broker:9092/topic
Working examples of every type ship in
plugins/examples/ —
start there, then read Developing a plugin.
Installing plugins
loadr ships a small core; extra protocols, outputs and helpers are delivered
as plugins. The easiest way to get one is to install it by name from the
plugin index — a JSON catalogue that maps a short name to the right
per-platform artifact, with a sha256 for each download.
loadr plugin install mongo
This resolves mongo in the index, picks the artifact for your host target
(e.g. x86_64-unknown-linux-gnu), checks it against the plugin ABI your
loadr build provides, downloads it, verifies its sha256, unpacks it and
installs it into your plugins directory (~/.loadr/plugins, or
$LOADR_PLUGINS_DIR).
The index
The default index is the catalogue published on main:
https://raw.githubusercontent.com/levantar-ai/loadr/main/plugins/index.json
Override it with --index <url> or the LOADR_PLUGIN_INDEX environment
variable (the flag wins). The index format is versioned ("schema": 1); an
unknown schema is rejected rather than mis-parsed.
{
  "schema": 1,
  "plugins": {
    "mongo": {
      "kind": "protocol",
      "description": "MongoDB protocol …",
      "latest": "1.0.0",
      "versions": {
        "1.0.0": {
          "min_loadr_abi": "1.0",
          "artifacts": {
            "x86_64-unknown-linux-gnu": {
              "url": "https://…/mongo-x86_64-unknown-linux-gnu.tar.gz",
              "sha256": "…",
              "entry": "libloadr_plugin_mongo.so"
            }
          }
        }
      }
    }
  }
}
Each artifact tarball/zip contains a plugin.toml and the plugin's dynamic
library. The per-platform artifact filename matters:
libloadr_plugin_<name>.so on Linux, .dylib on macOS and
loadr_plugin_<name>.dll on Windows. After unpacking, loadr reconciles the
installed artifact's name with the manifest's entry.
Commands
# Search the index
loadr plugin search mongo

# Install the latest indexed version for this host
loadr plugin install mongo

# Pin a version / override the host target
loadr plugin install mongo --version 1.0.0 --target aarch64-apple-darwin

# Re-install newer, ABI-compatible versions
loadr plugin update            # every index-managed plugin
loadr plugin update mongo      # just one

# Remove an installed plugin
loadr plugin remove mongo

# List what's installed / inspect one
loadr plugin list
loadr plugin info mongo
ABI compatibility
Every indexed version declares a min_loadr_abi. loadr refuses to install a
build that needs a newer plugin ABI than the running binary provides, with a
clear message telling you to upgrade loadr or pick another version. The
native loader performs the precise abi_stable layout check at load time as a
second line of defence.
If the index has no artifact for your target triple, the install fails listing the targets that are available.
Trust and verification
-
Index installs are the trusted path. The sha256 in the index is always verified after download; a mismatch aborts the install.
-
Other sources require
--allow-untrusted, because their integrity is not pinned by the official index:# A GitHub release's assets (asset matched to the host target triple) loadr plugin install github:owner/repo@v1.2.0 --allow-untrusted # An arbitrary archive URL or a local archive file loadr plugin install https://example.com/myplugin.tar.gz --allow-untrusted loadr plugin install ./dist/myplugin.tar.gz --allow-untrusted -
A local directory containing
plugin.tomlinstalls directly, unchanged from earlierloadrreleases and handy during development:loadr plugin install ./dist
Signing (TODO). sha256 pins integrity today. Signature / SLSA-provenance verification of the index and artifacts is a planned hook: the index
schemawill carry a signature block andloadrwill verify it before trusting any entry. Until then, the index is trusted by transport (HTTPS to the project's repo) and each artifact by its sha256.
Where plugins live
Installed plugins are directories under the plugins dir, one per plugin:
~/.loadr/plugins/
└── mongo/
    ├── plugin.toml
    └── libloadr_plugin_mongo.so
Disable one without removing it (loadr plugin disable mongo writes a
disabled marker); re-enable with loadr plugin enable mongo.
WASM plugins
WASM plugins are component-model
components against the WIT world in
crates/loadr-plugin-api/wit/loadr.wit.
The host runs them in wasmtime with no filesystem and no network — a
malicious or buggy extractor can waste CPU, nothing else.
The interface (abridged):
package loadr:plugin;

interface meta {
  record info { name: string, version: string, kind: string, description: string }
  describe: func() -> info;
}

interface extractor {
  /// body + headers + the plugin's JSON config -> extracted value (or none)
  extract: func(body: list<u8>, headers: list<tuple<string,string>>, config: string) -> option<string>;
}

interface assertion {
  record verdict { pass: bool, detail: string }
  check: func(status: s64, body: list<u8>, headers: list<tuple<string,string>>,
              duration-ms: f64, config: string) -> verdict;
}
Writing one in Rust
cargo new --lib my-extractor && cd my-extractor
rustup target add wasm32-wasip2
# Cargo.toml
[lib]
crate-type = ["cdylib"]
[dependencies]
wit-bindgen = "0.58"
#![allow(unused)]
fn main() {
wit_bindgen::generate!({ path: "wit", world: "loadr-plugin" });

struct Plugin;

impl exports::loadr::plugin::meta::Guest for Plugin {
    fn describe() -> exports::loadr::plugin::meta::Info { /* ... */ }
}

impl exports::loadr::plugin::extractor::Guest for Plugin {
    fn extract(body: Vec<u8>, _headers: Vec<(String, String)>, config: String) -> Option<String> {
        let cfg: serde_json::Value = serde_json::from_str(&config).ok()?;
        // ... your logic ...
    }
}

export!(Plugin);
}
cargo build --release --target wasm32-wasip2
# target/wasm32-wasip2/release/my_extractor.wasm is the component
Package it with a plugin.toml (type = "wasm") and loadr plugin install.
Any language with component tooling (Go via TinyGo, Python via componentize-py,
JS via jco) works the same way.
Using it
plugins: [ { name: my-extractor, config: { left: "id=", right: ";" } } ]
scenarios:
  s:
    flow:
      - request:
          url: /page
          extract:
            - { type: plugin, name: order_id, plugin: my-extractor }
(Plugin extractors/assertions are addressed by plugin name; their config
from the plugins: entry is passed to every call.)
Native plugins
Native plugins are dynamic libraries (.so/.dylib/.dll) using
abi_stable for a checked, versioned ABI:
at load time the library's type layouts are validated against the host's, so
mismatched versions fail with a clear error instead of undefined behaviour.
Data crosses the boundary as JSON strings — a deliberate trade: marshalling cost is negligible at plugin-call frequency, and it keeps the ABI surface tiny and forward-compatible.
The interface
loadr-plugin-api exposes #[sabi_trait] object types:
#![allow(unused)]
fn main() {
#[sabi_trait]
pub trait FfiOutput {
    fn name(&self) -> RString;
    fn start(&mut self, config_json: RString) -> RResult<(), RString>;
    fn on_samples(&mut self, samples_json: RString);
    fn on_snapshot(&mut self, snapshot_json: RString);
    fn finish(&mut self, summary_json: RString);
}

#[sabi_trait]
pub trait FfiProtocol {
    fn name(&self) -> RString;
    /// request JSON -> response JSON ({status, headers, body_base64, duration_ms, ...})
    fn execute(&self, request_json: RString) -> RString;
}

#[sabi_trait]
pub trait FfiService {
    fn name(&self) -> RString;
    fn start(&mut self, config_json: RString) -> RResult<RString, RString>;
    fn stop(&mut self);
}
}
A plugin exports one root module advertising what it provides:
#![allow(unused)]
fn main() {
use loadr_plugin_api::export_loadr_plugin;

export_loadr_plugin! {
    info: my_info_fn,
    output: make_my_output,      // any subset of output / protocol / service
}
}
Building
# Cargo.toml
[lib]
crate-type = ["cdylib"]
[dependencies]
loadr-plugin-api = "0.1"
abi_stable = "0.11"
cargo build --release
# package target/release/libmy_plugin.so with a plugin.toml (type = "native")
The two shipped examples are the best reference:
plugins/examples/native-output— an output plugin writing snapshot digests to a file;plugins/examples/native-protocol— anecho-protoprotocol handler, including howrequest.options.pluginconfig reaches yourexecute.
Safety notes
Native plugins run in-process with full privileges — treat them like any
dependency you compile in. Prefer WASM for anything that doesn't strictly
need native capability. loadr refuses to load a plugin whose abi_stable
layout check fails, and loadr plugin info shows what a library exports
before you enable it.
Writing a plugin in another language (C ABI)
loadr's native plugins normally use
abi_stable, whose compile-time layout
handshake is Rust-to-Rust only — no other language can reproduce it. To
let you write a protocol plugin in C, Go, Zig, or anything that can emit a
C shared library, loadr also accepts plugins built against a small, frozen
plain C ABI: pointers, lengths, and a plugin-owned allocator. No
abi_stable, no Rust types cross the boundary.
When a native library is loaded, loadr probes for the C entry symbol
(loadr_plugin_abi_version). If present it is loaded as a C-ABI plugin;
otherwise it falls back to the abi_stable path. Both kinds route through the
same engine machinery, so scheme routing, metrics, and plugin.toml work
identically.
Scope. The C ABI currently covers
protocolplugins only. Outputs and services remain Rust/abi_stable (they have richer, stateful lifecycles).
The C symbol contract (ABI version 1)
A C-ABI plugin is a shared library that exports exactly these four
extern "C" symbols:
#include <stddef.h>
#include <stdint.h>

// The C-ABI version this plugin targets. The host refuses to load a plugin
// whose version it does not understand (current host version: 1).
uint32_t loadr_plugin_abi_version(void);

// PluginInfo as UTF-8 JSON; *out_len receives the byte length.
// Buffer is plugin-owned: the host copies it, then calls loadr_plugin_free.
uint8_t *loadr_plugin_info(size_t *out_len);

// Execute one request. `req`/`req_len` is a UTF-8 JSON FfiRequest.
// Returns a UTF-8 JSON FfiResponse of length *out_len, plugin-owned
// (freed via loadr_plugin_free).
uint8_t *loadr_plugin_execute(const uint8_t *req, size_t req_len, size_t *out_len);

// Free a buffer previously returned by info()/execute(), with the exact
// ptr/len the plugin returned.
void loadr_plugin_free(uint8_t *ptr, size_t len);
Allocator rule
Every buffer the plugin returns is plugin-owned. The host copies the bytes
it needs and then hands the buffer back to loadr_plugin_free(ptr, len) with
the exact pointer and length the plugin returned. This keeps allocation and
deallocation on the same side of the boundary — the host never frees plugin
memory with its own allocator. A null return with *out_len == 0 is treated
as an empty buffer and is not passed to free.
Threading rule
The host calls loadr_plugin_execute concurrently from many worker
threads (one virtual user per thread, all sharing the one loaded library).
Your execute must be thread-safe — exactly the contract the Rust
FfiProtocol: Send + Sync bound expresses. info and abi_version are called
once, on the loading thread, before any execute.
No unwinding across the boundary
execute must not let an exception / panic / longjmp cross the FFI boundary
(undefined behaviour). Report failures in the response error field instead.
ABI versioning
loadr_plugin_abi_version returns the C-ABI version the plugin was written
against. The host compares it to its own LOADR_C_ABI_VERSION (currently 1)
and refuses to load a mismatch with a clear error. This version is separate
from the abi_stable surface version; the two evolve independently. It is bumped
only on an incompatible change to the four symbols above. (Adding a field to
the request/response JSON is not a break — see below.)
The JSON request / response shapes
Payloads cross as JSON, identical to the abi_stable path
(loadr_plugin_api::native::FfiRequest / FfiResponse). Adding a field is
forward-compatible, never an ABI break.
Request (loadr_plugin_execute input):
{
  "name": "echo something",      // request name from the YAML flow
  "method": "SEND",
  "url": "cecho://host/path",
  "headers": [["x-test", "1"]],
  "body_b64": "cGluZw==",        // request body, base64
  "timeout_ms": 5000,
  "options": { ... },             // the request's `plugin:` block (may be absent)
  "config": { ... }               // manifest [config] + per-run overrides
}
Response (loadr_plugin_execute output):
{
  "status": 200,                  // i64; your protocol's status code
  "status_text": "OK",
  "headers": [["x-cecho", "1"]],
  "body_b64": "cGluZw==",        // response body, base64
  "duration_ms": 1.5,             // request latency you measured
  "error": null,                  // a string fails the request
  "extras": { "echoed_by": "c-echo" }  // free-form; surfaces in metrics/checks
}
All fields except status/body_b64 are optional and default sensibly.
plugin.toml
Package the library with a manifest, same as any native plugin. You may add an
optional abi = "c" hint, but it is not required — the host auto-detects:
[plugin]
name = "cecho"
version = "0.1.0"
kind = "protocol"
type = "native"
abi = "c"                 # optional hint; "native" forces abi_stable
entry = "libloadr_plugin_cecho.so"
description = "Echo protocol plugin written in C (C-ABI)"
schemes = ["cecho"]       # URL scheme(s) this plugin serves
Worked example: c-echo
A complete, dependency-free C plugin ships in
examples/plugins/c-echo/.
It serves the cecho:// scheme and echoes each request body back with status
200.
Build it
cd examples/plugins/c-echo
make                 # -> libloadr_plugin_cecho.so
Platform notes for the shared library:
| Platform | Command | Artifact |
|---|---|---|
| Linux | cc -O2 -fPIC -shared -o libloadr_plugin_cecho.so cecho.c | .so |
| macOS | cc -O2 -fPIC -dynamiclib -o libloadr_plugin_cecho.dylib cecho.c | .dylib |
| Windows | cl /LD /Fe:loadr_plugin_cecho.dll cecho.c | .dll |
Set entry in plugin.toml to match the artifact name for your platform.
Run it
Reference the built artifact straight from a test plan:
name: c-echo-smoke
plugins:
  - name: cecho
    path: examples/plugins/c-echo/libloadr_plugin_cecho.so

scenarios:
  echo:
    executor: shared-iterations
    vus: 2
    iterations: 4
    flow:
      - request:
          name: echo something
          url: cecho://localhost/whatever
          method: SEND
          body: "ping-from-loadr"
          assert:
            - { type: status, equals: 200 }
            - { type: body_contains, value: "ping-from-loadr" }
$ loadr run c-echo-smoke.yaml
  c-echo-smoke — 1 scenario(s)
  cecho_reqs....................: 4
  http_req_failed...............: 0.00% — ✓ 0 ✗ 4
The cecho:// scheme routed to the plugin, every request echoed its body, and
both assertions passed. The metric family (cecho_*) is derived from the
plugin's name, exactly as for Rust native plugins.
Implementing it
The interesting parts of cecho.c:
#define LOADR_C_ABI_VERSION 1u

uint32_t loadr_plugin_abi_version(void) { return LOADR_C_ABI_VERSION; }

void loadr_plugin_free(uint8_t *ptr, size_t len) { (void)len; free(ptr); }

uint8_t *loadr_plugin_info(size_t *out_len) {
    // malloc'd JSON: name/version/kind="protocol"/description/schemes
    return dup_bytes("{\"name\":\"cecho\", ... ,\"schemes\":[\"cecho\"]}", out_len);
}

uint8_t *loadr_plugin_execute(const uint8_t *req, size_t req_len, size_t *out_len) {
    // 1. read body_b64 / method out of the request JSON
    // 2. build a malloc'd FfiResponse JSON that echoes the body
    // 3. write its length to *out_len and return it
}
c-echo does minimal hand-rolled JSON scanning to stay dependency-free; a real
plugin would link a JSON library (e.g. cJSON, or use Go's encoding/json).
Example: a plugin in Go
Any toolchain that emits a C shared library exporting the four symbols works.
The repo ships a complete Go example at examples/plugins/go-echo/ — a sibling
to c-echo that serves the goecho:// scheme. Go builds a C shared library
with go build -buildmode=c-shared, exposes functions to C with //export
directives, and — crucially — allocates returned buffers with the C
allocator (C.malloc) so the host's loadr_plugin_free (which calls C.free)
matches. Because Go has encoding/json, parsing the request and emitting the
response is just struct (un)marshalling — no hand-rolled JSON like the C example.
package main

/*
#include <stdint.h>
#include <stdlib.h>
*/
import "C"

import (
	"encoding/json"
	"unsafe"
)

const loadrCABIVersion = 1

func main() {} // required by -buildmode=c-shared

//export loadr_plugin_abi_version
func loadr_plugin_abi_version() C.uint32_t { return C.uint32_t(loadrCABIVersion) }

//export loadr_plugin_free
func loadr_plugin_free(ptr *C.uint8_t, length C.size_t) { C.free(unsafe.Pointer(ptr)) }

//export loadr_plugin_execute
func loadr_plugin_execute(req *C.uint8_t, reqLen C.size_t, outLen *C.size_t) *C.uint8_t {
	in := C.GoBytes(unsafe.Pointer(req), C.int(reqLen))
	var r struct {
		Method  string `json:"method"`
		BodyB64 string `json:"body_b64"`
	}
	_ = json.Unmarshal(in, &r)
	resp, _ := json.Marshal(map[string]any{
		"status": 200, "status_text": "OK",
		"body_b64": r.BodyB64, "extras": map[string]any{"echoed_by": "go-echo"},
	})
	return cBytes(resp, outLen)
}

// cBytes copies into a C-allocated buffer so loadr_plugin_free (C.free) matches.
func cBytes(b []byte, outLen *C.size_t) *C.uint8_t {
	if len(b) == 0 {
		*outLen = 0
		return nil
	}
	p := C.malloc(C.size_t(len(b)))
	copy(unsafe.Slice((*byte)(p), len(b)), b)
	*outLen = C.size_t(len(b))
	return (*C.uint8_t)(p)
}
(loadr_plugin_info is elided here for brevity — see the full source.) Build,
install and run it exactly like the C example:
make -C examples/plugins/go-echo            # -> libloadr_plugin_goecho.so
mkdir -p dist && cp examples/plugins/go-echo/plugin.toml dist/ \
  && cp examples/plugins/go-echo/libloadr_plugin_goecho.so dist/
loadr plugin install dist                   # ✓ installed `goecho` v0.1.0 (protocol, native)
loadr run examples/35-go-echo.yaml          # goecho_reqs: …  http_req_failed: 0.00%
The same recipe applies to Zig, Swift, Rust (a cdylib exporting the plain C
symbols instead of the abi_stable ones), or any language with a C FFI.
Safety
Like all native plugins, C-ABI plugins run in-process with full privileges — treat them as trusted code. The host validates the ABI version on load and copies every buffer immediately, but it cannot sandbox native code. Prefer WASM plugins for anything that does not need native capability.
MongoDB plugin
loadr-plugin-mongo adds MongoDB as a load-test target. It is a native
protocol plugin: MongoDB support is not built into loadr core — the heavy
mongodb Rust driver ships only inside this plugin's dynamic library. Once the
plugin is installed, a request to a mongodb:// (or mongo://) URL routes
straight to it.
It is the first plugin built on loadr's runtime protocol-plugin path; the contract it uses is documented in Developing a plugin.
Build and install
cargo build -p loadr-plugin-mongo --release

# `loadr plugin install` copies a directory that holds plugin.toml next to the
# artifact named by its `entry`. Stage the built cdylib beside the manifest:
mkdir -p dist
cp plugins/loadr-plugin-mongo/plugin.toml dist/
cp target/release/libloadr_plugin_mongo.so dist/   # .dylib on macOS, .dll on Windows
loadr plugin install dist
loadr plugin info mongo
Installing copies plugin.toml and the artifact into ~/.loadr/plugins/mongo/.
The manifest declares the URL schemes the plugin serves:
[plugin]
name = "mongo"
kind = "protocol"
type = "native"
entry = "libloadr_plugin_mongo.so"
schemes = ["mongodb", "mongo"]
Use it in a test
List the plugin under plugins: and target a mongodb:// URL. The operation
is described by the request's plugin: block:
plugins:
  - name: mongo            # or: { name: mongo, path: target/release/libloadr_plugin_mongo.so }

scenarios:
  main:
    executor: constant-vus
    vus: 5
    duration: 15s
    flow:
      - request:
          name: insert product
          url: mongodb://user:pass@host:27017/loadr
          plugin:
            operation: insert
            collection: products
            document: { name: "vu-${vu}-item", price: 12.5, stock: 3 }
          assert:
            - { type: status, equals: 1 }      # 1 = ok, 0 = driver error

      - request:
          name: find cheap products
          url: mongodb://user:pass@host:27017/loadr
          plugin:
            operation: find
            collection: products
            filter: { price: { $lt: 50 } }
            limit: 100

      - request:
          name: stock by tag
          url: mongodb://user:pass@host:27017/loadr
          plugin:
            operation: aggregate
            collection: products
            pipeline:
              - { $unwind: "$tags" }
              - { $group: { _id: "$tags", total: { $sum: "$stock" } } }
A complete runnable plan is in examples/28-mongo.yaml.
Request options (plugin: block)
| Key | Type | Used by | Notes |
|---|---|---|---|
operation | string | all | insert, find, update, delete, aggregate, command |
database | string | all (optional) | Defaults to the database in the URI path |
collection | string | all except command | Required |
document | object | insert | Insert one document |
documents | array | insert | Insert many documents |
filter | object | find, update, delete | Defaults to {} (match all) |
update | object | update | e.g. { "$set": { ... } } |
pipeline | array | aggregate | Aggregation stages |
command | object | command | Raw database command |
limit | integer | find | Optional |
multi | bool | update, delete | Operate on many docs (default false) |
${...} placeholders inside any string leaf are interpolated by loadr before
the plugin runs, so values can reference VU state, variables, and data feeds.
Metrics
loadr turns the plugin's response into a dedicated metric family named after the
protocol (mongo):
| Metric | Kind | Meaning |
|---|---|---|
mongo_reqs | counter | One per operation |
mongo_req_duration | trend | Operation latency (ms) |
mongo_docs | counter | Documents inserted / matched+modified / deleted / returned |
A request is marked failed when the operation errors (response status 0).
http_req_failed therefore tracks the Mongo failure rate too, and checks /
assert entries can gate on status (1 = ok).
Connection pooling
The plugin keeps an internal pool of mongodb::Client handles keyed by the full
connection URI, shared across every VU. A Client is itself an internally
pooled, cheaply-cloned handle, so one per distinct URI is the correct model
under load — the first request for a URI establishes it, and all subsequent
requests (any VU) reuse it. The plugin owns a single Tokio runtime and
block_ons the async driver, because the protocol ABI is synchronous and
carries no per-VU context across the FFI boundary.
Testing against a real server
The example harness brings up mongo:7 with seed data:
docker compose -f examples/harness/docker-compose.yml up -d mongo

LOADR_TEST_MONGO_URL=mongodb://loadr:loadr@127.0.0.1:27017/loadr \
  cargo test -p loadr-plugin-mongo
The integration tests no-op when LOADR_TEST_MONGO_URL is unset.
PostgreSQL plugin
loadr-plugin-postgres adds PostgreSQL as a load-test target. It is a
native protocol plugin: PostgreSQL support is not built into loadr core —
the heavy sqlx driver ships only inside
this plugin's dynamic library. The plugin enables only sqlx's postgres
feature, so it never pulls in sqlx-mysql (or its transitive rsa dependency,
RUSTSEC-2023-0071): a PostgreSQL-only build is fully advisory-clean. MySQL
lives in the separate MySQL plugin. Once installed, a request to a
postgres:// or postgresql:// URL routes straight to this plugin.
The contract it uses is documented in Developing a plugin.
When to use
Reach for this when the thing under test is the database: validating a schema
or index under write pressure, sizing a connection pool, finding the row count
at which a query falls over, or proving latency holds at a steady query rate.
For an application that merely uses a database behind an HTTP API, test the API
with the http handler instead.
Build and install
cargo build -p loadr-plugin-postgres --release

# `loadr plugin install` copies a directory that holds plugin.toml next to the
# artifact named by its `entry`. Stage the built cdylib beside the manifest:
mkdir -p dist
cp plugins/loadr-plugin-postgres/plugin.toml dist/
cp target/release/libloadr_plugin_postgres.so dist/   # .dylib on macOS, .dll on Windows
loadr plugin install dist
loadr plugin info postgres
Installing copies plugin.toml and the artifact into ~/.loadr/plugins/postgres/.
The manifest declares the URL schemes the plugin serves:
[plugin]
name = "postgres"
kind = "protocol"
type = "native"
entry = "libloadr_plugin_postgres.so"
schemes = ["postgres", "postgresql"]
The target URL
postgres://[user[:password]@]host[:port][/database][?params]
- scheme is
postgres(aliaspostgresql). - port defaults to the PostgreSQL standard port (
5432). - credentials, database, and query parameters are passed straight to the
driver, so any URL
sqlxaccepts works here — including?sslmode=requirefor TLS.
Use it in a test
List the plugin under plugins: and target a postgres:// URL. The statement
and its bind parameters go in the request's sql block:
plugins:
  - name: postgres      # or: { name: postgres, path: target/release/libloadr_plugin_postgres.so }

scenarios:
  main:
    executor: constant-vus
    vus: 10
    duration: 30s
    flow:
      - request:
          name: list cheap products
          url: postgres://loadr:loadr@db.example.com:5432/loadr
          sql:
            query: SELECT id, name, price FROM products WHERE price < $1 ORDER BY price
            params: ["50"]
          checks:
            - { type: status, equals: 1 }                 # 1 = ok, 0 = DB error
            - { type: duration, name: query is fast, max: 250ms }

      - request:
          name: insert order
          url: postgres://loadr:loadr@db.example.com:5432/loadr
          sql:
            query: INSERT INTO orders (sku, qty) VALUES ($1, $2)
            params: ["${row.sku}", "${row.qty}"]
          assert:
            - { type: status, equals: 1 }
A complete runnable plan is in examples/27-postgres.yaml.
Expressing the query
query— the SQL to run. Use PostgreSQL's$1, $2, …placeholder syntax for parameters.params— positional bind values, bound safely by the driver (never string-spliced, so there is no SQL-injection surface). Each value is given as text; the plugin infers a type so comparisons against numeric columns work — a value that parses as an integer binds as an integer, a decimal as a float, everything else as text.
${...} interpolation works in both query and params, so per-VU values and
data-feed columns flow straight into the statement. As a shorthand, a request
with no sql block uses its body as the query text (no parameters); an
empty query is rejected.
Status, rows, and errors
A request succeeds when the query executes without a database error:
| Outcome | status | error | extras.rows |
|---|---|---|---|
| SELECT / WITH / SHOW … | 1 | — | rows returned |
| INSERT / UPDATE / DELETE | 1 | — | rows affected |
| database error (bad SQL, constraint, …) | 0 | the DB message | — |
| connection failure / timeout | 0 | the transport error | — |
extras carries:
extras.backend—postgres.extras.rows— rows returned (row-producing statements) or affected (DML).
The response body is the row count rendered as text, so body-based checks
and extraction still work.
Metrics
loadr turns the plugin's response into the postgres metric family:
| Metric | Kind | Meaning |
|---|---|---|
postgres_reqs | counter | queries executed |
postgres_req_duration | trend (time) | per-query latency (ms) |
postgres_rows | counter | total rows returned/affected |
thresholds:
  checks: [ "rate>0.99" ]
  postgres_req_duration: [ "p(95)<100ms" ]
A request is marked failed when the query errors (response status 0), so
http_req_failed (the shared failure-rate metric) tracks DB errors too.
Connection pooling
The plugin keeps an internal sqlx::Pool keyed by the full connection URI,
shared across every VU. A pool is itself a set of cheaply-cloned, reused
connections, so one per distinct URI is the correct model under load — the first
request for a URI establishes it, and all subsequent requests (any VU) reuse it.
The plugin owns a single Tokio runtime and block_ons the async driver, because
the protocol ABI is synchronous and carries no per-VU context across the FFI
boundary.
Testing against a real server
The example harness brings up PostgreSQL with a seeded products table:
docker compose -f examples/harness/docker-compose.yml up -d postgres

LOADR_TEST_POSTGRES_URL=postgres://loadr:loadr@127.0.0.1:5432/loadr \
  cargo test -p loadr-plugin-postgres
The integration tests no-op when LOADR_TEST_POSTGRES_URL is unset.
MySQL plugin
loadr-plugin-mysql adds MySQL as a load-test target. It is a native
protocol plugin: MySQL support is not built into loadr core — the heavy
sqlx driver ships only inside this
plugin's dynamic library. The plugin enables only sqlx's mysql feature.
Advisory note. The
mysqlfeature pulls insqlx-mysqland its transitiversacrate (a Marvin timing side-channel with no fixed release yet).rsais only reachable for MySQLcaching_sha2/sha256password auth over a non-TLS connection, and load-test targets are operator-controlled, so this is accepted. If you only need PostgreSQL, install the advisory-clean PostgreSQL plugin instead —rsalives only in this MySQL plugin.
Once installed, a request to a mysql:// URL routes straight to this plugin.
The contract it uses is documented in
Developing a plugin.
When to use
Reach for this when the thing under test is the database: validating a schema
or index under write pressure, sizing a connection pool, finding the row count
at which a query falls over, or proving latency holds at a steady query rate.
For an application that merely uses a database behind an HTTP API, test the API
with the http handler instead.
Build and install
cargo build -p loadr-plugin-mysql --release

# `loadr plugin install` copies a directory that holds plugin.toml next to the
# artifact named by its `entry`. Stage the built cdylib beside the manifest:
mkdir -p dist
cp plugins/loadr-plugin-mysql/plugin.toml dist/
cp target/release/libloadr_plugin_mysql.so dist/   # .dylib on macOS, .dll on Windows
loadr plugin install dist
loadr plugin info mysql
Installing copies plugin.toml and the artifact into ~/.loadr/plugins/mysql/.
The manifest declares the URL scheme the plugin serves:
[plugin]
name = "mysql"
kind = "protocol"
type = "native"
entry = "libloadr_plugin_mysql.so"
schemes = ["mysql"]
The target URL
mysql://[user[:password]@]host[:port][/database][?params]
- scheme is
mysql. - port defaults to the MySQL standard port (
3306). - credentials, database, and query parameters are passed straight to the
driver, so any URL
sqlxaccepts works here — including?ssl-mode=REQUIREDfor TLS.
Use it in a test
List the plugin under plugins: and target a mysql:// URL. The statement and
its bind parameters go in the request's sql block:
plugins:
  - name: mysql         # or: { name: mysql, path: target/release/libloadr_plugin_mysql.so }

scenarios:
  main:
    executor: constant-vus
    vus: 10
    duration: 30s
    flow:
      - request:
          name: count in-stock products
          url: mysql://loadr:loadr@db.example.com:3306/loadr
          sql:
            query: SELECT COUNT(*) AS n FROM products WHERE stock > ?
            params: ["0"]
          checks:
            - { type: status, equals: 1 }                 # 1 = ok, 0 = DB error
            - { type: duration, name: query is fast, max: 250ms }

      - request:
          name: insert order
          url: mysql://loadr:loadr@db.example.com:3306/loadr
          sql:
            query: INSERT INTO orders (sku, qty) VALUES (?, ?)
            params: ["${row.sku}", "${row.qty}"]
          assert:
            - { type: status, equals: 1 }
A complete runnable plan is in examples/29-mysql.yaml.
Expressing the query
query— the SQL to run. Use MySQL's?placeholder syntax for parameters.params— positional bind values, bound safely by the driver (never string-spliced, so there is no SQL-injection surface). Each value is given as text; the plugin infers a type so comparisons against numeric columns work — a value that parses as an integer binds as an integer, a decimal as a float, everything else as text.
${...} interpolation works in both query and params, so per-VU values and
data-feed columns flow straight into the statement. As a shorthand, a request
with no sql block uses its body as the query text (no parameters); an
empty query is rejected.
Status, rows, and errors
A request succeeds when the query executes without a database error:
| Outcome | status | error | extras.rows |
|---|---|---|---|
| SELECT / WITH / SHOW … | 1 | — | rows returned |
| INSERT / UPDATE / DELETE | 1 | — | rows affected |
| database error (bad SQL, constraint, …) | 0 | the DB message | — |
| connection failure / timeout | 0 | the transport error | — |
extras carries:
extras.backend—mysql.extras.rows— rows returned (row-producing statements) or affected (DML).
The response body is the row count rendered as text, so body-based checks
and extraction still work.
Metrics
loadr turns the plugin's response into the mysql metric family:
| Metric | Kind | Meaning |
|---|---|---|
mysql_reqs | counter | queries executed |
mysql_req_duration | trend (time) | per-query latency (ms) |
mysql_rows | counter | total rows returned/affected |
thresholds:
  checks: [ "rate>0.99" ]
  mysql_req_duration: [ "p(95)<100ms" ]
A request is marked failed when the query errors (response status 0), so
http_req_failed (the shared failure-rate metric) tracks DB errors too.
Connection pooling
The plugin keeps an internal sqlx::Pool keyed by the full connection URI,
shared across every VU. A pool is itself a set of cheaply-cloned, reused
connections, so one per distinct URI is the correct model under load — the first
request for a URI establishes it, and all subsequent requests (any VU) reuse it.
The plugin owns a single Tokio runtime and block_ons the async driver, because
the protocol ABI is synchronous and carries no per-VU context across the FFI
boundary.
Testing against a real server
The example harness brings up MySQL with a seeded products table:
docker compose -f examples/harness/docker-compose.yml up -d mysql

LOADR_TEST_MYSQL_URL=mysql://loadr:loadr@127.0.0.1:3306/loadr \
  cargo test -p loadr-plugin-mysql
The integration tests no-op when LOADR_TEST_MYSQL_URL is unset.
Redis plugin
loadr-plugin-redis adds Redis as a load-test target. It is a native
protocol plugin: Redis support is not built into loadr core. The plugin speaks
the RESP wire protocol directly over a raw TCP connection — no client
library, no OpenSSL, no pipelining — so every request is one command in, one
reply out, timed end to end. Once the plugin is installed, a request to a
redis:// (or rediss://) URL routes straight to it.
The contract it uses is documented in Developing a plugin.
Build and install
cargo build -p loadr-plugin-redis --release

# `loadr plugin install` copies a directory that holds plugin.toml next to the
# artifact named by its `entry`. Stage the built cdylib beside the manifest:
mkdir -p dist
cp plugins/loadr-plugin-redis/plugin.toml dist/
cp target/release/libloadr_plugin_redis.so dist/   # .dylib on macOS, .dll on Windows
loadr plugin install dist
loadr plugin info redis
Installing copies plugin.toml and the artifact into ~/.loadr/plugins/redis/.
The manifest declares the URL schemes the plugin serves:
[plugin]
name = "redis"
kind = "protocol"
type = "native"
entry = "libloadr_plugin_redis.so"
schemes = ["redis", "rediss"]
The target URL
redis://host[:port][/db]
- scheme must be
redis(orrediss). - port defaults to
6379when omitted. - db — an optional numeric path selects a database. On a freshly opened
connection the plugin issues
SELECT <db>before the first command; a failingSELECTsurfaces as a connection error.redis://host/3selects db 3;redis://hostleaves the default db 0.
Use it in a test
List the plugin under plugins: and target a redis:// URL. The command is the
plugin.command argv array:
plugins:
  - name: redis            # or: { name: redis, path: target/release/libloadr_plugin_redis.so }

scenarios:
  main:
    executor: constant-vus
    vus: 20
    duration: 15s
    flow:
      - request:
          name: set session
          url: redis://cache.example.com:6379
          plugin:
            command: ["SET", "session:${vu}", "active"]
          checks:
            - { type: status, equals: 0 }      # 0 = OK, 1 = RESP error reply
            - { type: body_contains, value: OK }

      - request:
          name: get session
          url: redis://cache.example.com:6379
          plugin:
            command: ["GET", "session:${vu}"]
          checks:
            - { type: body_contains, value: active }

      - request:
          name: increment counter
          url: redis://cache.example.com:6379
          plugin:
            command: ["INCR", "page:views"]
          checks:
            - { type: body_matches, pattern: '^[0-9]+$' }   # integer reply
A complete runnable plan is in examples/30-redis.yaml.
Expressing the command
The command is the plugin.command array — its elements (strings or numbers)
become the command name and its arguments, encoded as a RESP array of bulk
strings. As a fallback, the request body is accepted: a single line whose
whitespace-separated tokens form the command.
plugin: { command: ["SET", "session:${vu}", "active"] }   # preferred (argv)
# or, via the body fallback:
body: "PING"
${...} interpolation works inside any string element, so per-VU keys and
data-feed values flow straight into the command. The argv form (unlike the body
fallback) can carry argument values that contain spaces. An empty command is
rejected ("no redis command provided").
Replies, status, and body
A request succeeds at the transport level whenever the plugin gets a
well-formed RESP reply. Whether that reply is an error reply is reflected in
status:
| Reply | status | Body | extras.reply_type |
|---|---|---|---|
+OK simple string | 0 | the string (OK) | string |
:42 integer | 0 | the number as text (42) | integer |
$5\r\nhello bulk string | 0 | the bytes (hello) | bulk |
*… array | 0 | the array rendered as JSON | array |
$-1 / *-1 null | 0 | empty | nil |
-ERR … error reply | 1 | — | error |
So a missing key (GET of an absent key → nil) is a success with an empty
body, while -ERR unknown command is a failure (status = 1, the message
also lands in error). A connection failure or timeout is reported as
status: 0 with error set and no reply.
extras carries the parsed reply for assertions and extraction:
extras.reply_type— one ofstring,integer,bulk,array,nil,error.extras.value— the reply as JSON: a string for simple/bulk/error replies, a number for integers, an array for multi-bulk replies,nullfor nil.
Metrics
loadr turns the plugin's response into a dedicated metric family named after the
protocol (redis):
| Metric | Kind | Meaning |
|---|---|---|
redis_reqs | counter | One per command |
redis_req_duration | trend | Command round-trip latency (ms) |
A request is marked failed when the command errors (a RESP error reply, a
connection failure, or a timeout). http_req_failed therefore tracks the Redis
failure rate too, and checks / assert entries can gate on status (0 = ok).
thresholds:
  checks: [ "rate>0.99" ]
  redis_req_duration: [ "p(95)<100ms" ]
Connection pooling
The plugin keeps an internal pool of live RESP connections keyed by
host:port, shared across every VU. A command checks out an idle connection
(running the optional SELECT on a fresh socket only), reuses it for the
exchange, and returns it for the next caller — so concurrent VUs reuse a small
set of sockets rather than reconnecting on every command. A connection left in
an error state is dropped instead of returned, so the next caller transparently
re-establishes it. The plugin owns a single Tokio runtime and block_ons the
async socket I/O, because the protocol ABI is synchronous and carries no per-VU
context across the FFI boundary.
Testing against a real server
The example harness brings up redis:7-alpine:
docker compose -f examples/harness/docker-compose.yml up -d redis

LOADR_TEST_REDIS_URL=redis://127.0.0.1:6379 \
  cargo test -p loadr-plugin-redis
The integration tests no-op when LOADR_TEST_REDIS_URL is unset.
Apache Kafka plugin
loadr-plugin-kafka adds Apache Kafka as a load-test target. It is a native
protocol plugin: Kafka support is not built into loadr core — the Kafka client
ships only inside this plugin's dynamic library. Once the plugin is installed, a
request to a kafka:// URL routes straight to it.
The client is rskafka, a pure-Rust
Kafka client. It pulls in no librdkafka / C toolchain, so the plugin
cross-compiles cleanly to every loadr release target (Linux gnu x64/arm64, macOS
x64/arm64, Windows MSVC). The contract it uses is documented in
Developing a plugin.
Build and install
cargo build -p loadr-plugin-kafka --release

# `loadr plugin install` copies a directory that holds plugin.toml next to the
# artifact named by its `entry`. Stage the built cdylib beside the manifest:
mkdir -p dist
cp plugins/loadr-plugin-kafka/plugin.toml dist/
cp target/release/libloadr_plugin_kafka.so dist/   # .dylib on macOS, .dll on Windows
loadr plugin install dist
loadr plugin info kafka
Installing copies plugin.toml and the artifact into ~/.loadr/plugins/kafka/.
The manifest declares the URL scheme the plugin serves:
[plugin]
name = "kafka"
kind = "protocol"
type = "native"
entry = "libloadr_plugin_kafka.so"
schemes = ["kafka"]
Use it in a test
List the plugin under plugins: and target a kafka:// URL. The broker is the
URL authority and the topic is the URL path (kafka://broker:9092/topic). The
operation is described by the request's plugin: block:
plugins:
  - name: kafka            # or: { name: kafka, path: target/release/libloadr_plugin_kafka.so }

scenarios:
  producers:
    executor: constant-vus
    vus: 5
    duration: 15s
    flow:
      - request:
          name: produce event
          url: kafka://broker:9092/loadr-demo
          plugin:
            operation: produce
            key: "vu-${vu}"
            value: "event from vu ${vu} iter ${iteration}"
          assert:
            - { type: status, equals: 1 }      # 1 = ok, 0 = client error

  consumers:
    executor: constant-arrival-rate
    rate: 40
    duration: 15s
    pre_allocated_vus: 5
    max_vus: 20
    flow:
      - request:
          name: fetch from head
          url: kafka://broker:9092/loadr-demo
          plugin:
            operation: fetch
            offset: 0
            max_wait_ms: 500
A complete runnable plan is in examples/31-kafka.yaml.
Request options (plugin: block)
| Key | Type | Used by | Notes |
|---|---|---|---|
operation | string | all | produce or fetch |
topic | string | all | Defaults to the topic in the URL path |
partition | integer | all | Defaults to 0 |
key | scalar | produce | Optional record key (string/number/bool) |
value | scalar | produce | Record value (string/number/bool) |
offset | integer | fetch | Start offset (default 0) |
max_bytes | integer | fetch | Max bytes to return (default 1000000) |
max_wait_ms | integer | fetch | Broker max wait, ms (default 500) |
${...} placeholders inside any string leaf are interpolated by loadr before
the plugin runs, so values can reference VU state, variables, and data feeds.
Metrics
loadr turns the plugin's response into a dedicated metric family named after the
protocol (kafka):
| Metric | Kind | Meaning |
|---|---|---|
kafka_reqs | counter | One per operation |
kafka_req_duration | trend | Operation latency (ms) |
kafka_msgs | counter | Messages produced (1) / fetched (N) |
A request is marked failed when the operation errors (response status 0).
http_req_failed therefore tracks the Kafka failure rate too, and checks /
assert entries can gate on status (1 = ok).
Connection pooling
The plugin keeps an internal pool of rskafka Client handles keyed by the
broker authority parsed from the URL, plus a per-(broker, topic, partition)
PartitionClient cache layered on top, all shared across every VU. The first
request for a broker establishes the connection and subsequent requests (any VU)
reuse it. The plugin owns a single Tokio runtime and block_ons the async
client, because the protocol ABI is synchronous and carries no per-VU context
across the FFI boundary.
Records are produced and fetched uncompressed (NoCompression): the C-backed
compression codecs in rskafka are disabled so the dependency tree stays
pure-Rust and cross-compilable.
Testing against a real broker
The example harness brings up a single-node KRaft apache/kafka:3.8.0 (no
ZooKeeper) and creates the loadr-demo topic via a one-shot kafka-init
container:
docker compose -f examples/harness/docker-compose.yml up -d kafka kafka-init

LOADR_TEST_KAFKA_URL=kafka://127.0.0.1:9092/loadr-demo \
  cargo test -p loadr-plugin-kafka
The integration tests no-op when LOADR_TEST_KAFKA_URL is unset.
Elasticsearch plugin
loadr-plugin-elasticsearch adds Elasticsearch as a load-test target. It is a
native protocol plugin: Elasticsearch support is not built into loadr core.
Elasticsearch's API is plain HTTP/JSON, so the plugin talks to it directly over
loadr's own hyper + hyper-rustls stack (pure-Rust TLS via ring + webpki
roots — no system OpenSSL) rather than dragging in the heavy official
elasticsearch crate. That keeps the cdylib light and cross-compilable for
every release target. Once the plugin is installed, a request to an
elasticsearch:// (or es://) URL routes straight to it.
The contract it uses is documented in Developing a plugin.
Build and install
cargo build -p loadr-plugin-elasticsearch --release

# `loadr plugin install` copies a directory that holds plugin.toml next to the
# artifact named by its `entry`. Stage the built cdylib beside the manifest:
mkdir -p dist
cp plugins/loadr-plugin-elasticsearch/plugin.toml dist/
cp target/release/libloadr_plugin_elasticsearch.so dist/   # .dylib on macOS, .dll on Windows
loadr plugin install dist
loadr plugin info elasticsearch
Installing copies plugin.toml and the artifact into
~/.loadr/plugins/elasticsearch/. The manifest declares the URL schemes the
plugin serves:
[plugin]
name = "elasticsearch"
kind = "protocol"
type = "native"
entry = "libloadr_plugin_elasticsearch.so"
schemes = ["elasticsearch", "es"]
Use it in a test
List the plugin under plugins: and target an elasticsearch:// URL (both
elasticsearch:// and es:// are mapped onto plain http:// internally; a
http(s):// URL is also served). Basic-auth credentials in the URL —
elasticsearch://user:pass@host:9200 — become an HTTP Authorization: Basic
header. The operation is described by the request's plugin: block:
plugins:
  - name: elasticsearch    # or: { name: elasticsearch, path: target/release/libloadr_plugin_elasticsearch.so }

scenarios:
  main:
    executor: constant-vus
    vus: 5
    duration: 15s
    flow:
      - request:
          name: index product
          url: elasticsearch://host:9200
          plugin:
            operation: index
            index: products
            document: { name: "vu-${vu}-item", price: 12.5, stock: 3 }
          assert:
            - { type: status, equals: 1 }      # 1 = ok, 0 = error

      - request:
          name: bulk index
          url: elasticsearch://host:9200
          plugin:
            operation: bulk
            index: products
            operations:
              - { index: {} }
              - { name: "a", price: 1.0 }
              - { index: {} }
              - { name: "b", price: 2.0 }

      - request:
          name: search cheap products
          url: elasticsearch://host:9200
          plugin:
            operation: search
            index: products
            query: { size: 20, query: { range: { price: { lt: 50 } } } }
A complete runnable plan is in examples/33-elasticsearch.yaml.
Request options (plugin: block)
| Key | Type | Used by | Notes |
|---|---|---|---|
operation | string | all | index, get, search, bulk |
index | string | all* | Target index / alias. Required for index/get/search; optional for bulk |
id | string | index/get | Document id. Optional for index (server generates one), required for get |
document | object | index | The document body |
query | object | search | Elasticsearch query DSL body. Defaults to match_all when omitted |
operations | array | bulk | NDJSON action/source objects — alternating action lines ({ index: {} }) and source documents |
${...} placeholders inside any string leaf are interpolated by loadr before
the plugin runs, so values can reference VU state, variables, and data feeds.
Operation → REST mapping
| Operation | HTTP request |
|---|---|
index (with id) | PUT /{index}/_doc/{id} |
index (no id) | POST /{index}/_doc |
get | GET /{index}/_doc/{id} |
search | POST /{index}/_search |
bulk | POST /{index}/_bulk (or POST /_bulk) with application/x-ndjson |
Metrics
loadr turns the plugin's response into a dedicated metric family named after the
protocol (elasticsearch):
| Metric | Kind | Meaning |
|---|---|---|
elasticsearch_reqs | counter | One per operation |
elasticsearch_req_duration | trend | Operation latency (ms) |
elasticsearch_docs | counter | Documents written (index = 1, bulk = items succeeded) |
Search hits are also reported in the response extras.hits. A request is marked
failed when the operation errors — a non-2xx HTTP status, a transport error,
or a _bulk response with per-item errors (response status 0).
http_req_failed therefore tracks the Elasticsearch failure rate too, and
checks / assert entries can gate on status (1 = ok).
Connection pooling
The plugin keeps an internal pool of hyper clients keyed by the full request
URL, shared across every VU. A hyper-util legacy Client is itself an
internally-pooled, cheaply-cloned handle, so one per distinct base URL is the
correct model under load — the first request for a URL establishes it, and all
subsequent requests (any VU) reuse the pooled connections. The plugin owns a
single Tokio runtime and block_ons the async HTTP request, because the
protocol ABI is synchronous and carries no per-VU context across the FFI
boundary.
Testing against a real server
The example harness brings up elasticsearch:8.x as a single node with security
disabled (heap capped at 512 MB so CI doesn't OOM):
docker compose -f examples/harness/docker-compose.yml up -d elasticsearch

# ES is slow to start; wait for the cluster to report healthy first:
until curl -fsS http://127.0.0.1:9200/_cluster/health; do sleep 2; done

LOADR_TEST_ES_URL=http://127.0.0.1:9200 \
  cargo test -p loadr-plugin-elasticsearch
The integration tests no-op when LOADR_TEST_ES_URL is unset.
RabbitMQ plugin
loadr-plugin-rabbitmq adds RabbitMQ (AMQP 0.9.1) as a load-test target. It
is a native protocol plugin: RabbitMQ support is not built into loadr core —
the lapin AMQP client ships only inside
this plugin's dynamic library. lapin is pure Rust (no C or system-library
dependencies), so the cdylib cross-compiles to every loadr release target; TLS
(amqps://) is wired to rustls only, never OpenSSL/native-tls. Once the
plugin is installed, a request to an amqp://, amqps:// (or rabbitmq://)
URL routes straight to it.
The contract it uses is documented in Developing a plugin.
When to use
Reach for this when the thing under test is the broker: sizing a queue under
publish pressure, measuring end-to-end publish/consume latency, or finding the
ingest rate at which a consumer falls behind. For an application that merely
uses RabbitMQ behind an HTTP API, test the API with the http handler.
Build and install
cargo build -p loadr-plugin-rabbitmq --release

# `loadr plugin install` copies a directory that holds plugin.toml next to the
# artifact named by its `entry`. Stage the built cdylib beside the manifest:
mkdir -p dist
cp plugins/loadr-plugin-rabbitmq/plugin.toml dist/
cp target/release/libloadr_plugin_rabbitmq.so dist/   # .dylib on macOS, .dll on Windows
loadr plugin install dist
loadr plugin info rabbitmq
Installing copies plugin.toml and the artifact into ~/.loadr/plugins/rabbitmq/.
The manifest declares the URL schemes the plugin serves:
[plugin]
name = "rabbitmq"
kind = "protocol"
type = "native"
entry = "libloadr_plugin_rabbitmq.so"
schemes = ["amqp", "amqps", "rabbitmq"]
The target URL
amqp://[user[:password]@]host[:port][/vhost]
- scheme is
amqp(TLS variantamqps; aliasrabbitmq). - port defaults to the AMQP standard port (
5672, or5671foramqps). - vhost is URL-encoded in the path; the default vhost
/is written%2f, e.g.amqp://loadr:loadr@host:5672/%2f.
Use it in a test
List the plugin under plugins: and target an amqp:// URL. The operation is
described by the request's plugin: block:
plugins:
  - name: rabbitmq        # or: { name: rabbitmq, path: target/release/libloadr_plugin_rabbitmq.so }

scenarios:
  publish:
    executor: constant-vus
    vus: 5
    duration: 15s
    flow:
      - request:
          name: publish job
          url: amqp://loadr:loadr@host:5672/%2f
          plugin:
            operation: publish
            routing_key: loadr.work    # default exchange routes by queue name
            queue: loadr.work
            declare_queue: true
            body: '{"vu": ${vu}}'
          assert:
            - { type: status, equals: 1 }   # 1 = ok, 0 = broker error

  consume:
    executor: constant-arrival-rate
    rate: 60
    duration: 15s
    pre_allocated_vus: 10
    max_vus: 40
    flow:
      - request:
          name: get job
          url: amqp://loadr:loadr@host:5672/%2f
          plugin:
            operation: get
            queue: loadr.work
            ack: true
A complete runnable plan is in examples/32-rabbitmq.yaml.
Request options (plugin: block)
| Key | Type | Used by | Notes |
|---|---|---|---|
operation | string | all | publish or get |
exchange | string | publish | Target exchange (default "", the default exchange) |
routing_key | string | publish | Routing key; on the default exchange this is the queue name |
queue | string | get | Queue to consume from (falls back to routing_key) |
body | string | publish | Message body; a JSON object/array is serialised compactly |
declare_queue | bool | both | Declare a durable queue first (default false) |
ack | bool | get | Acknowledge the consumed message (default true) |
${...} placeholders inside any string leaf are interpolated by loadr before
the plugin runs, so values can reference VU state, variables, and data feeds.
A get against an empty queue is not an error: the request succeeds and
reports zero messages.
Metrics
loadr turns the plugin's response into a dedicated metric family named after the
protocol (rabbitmq):
| Metric | Kind | Meaning |
|---|---|---|
rabbitmq_reqs | counter | One per operation |
rabbitmq_req_duration | trend | Operation latency (ms) |
rabbitmq_msgs | counter | Messages published (1) or consumed (0 or 1) |
A request is marked failed when the operation errors (response status 0).
http_req_failed therefore tracks the RabbitMQ failure rate too, and checks /
assert entries can gate on status (1 = ok).
Connection pooling
The plugin keeps an internal pool of lapin connection + channel handles keyed
by the full connection URI, shared across every VU. The first request for a URI
opens one TCP connection and a multiplexed channel; all subsequent requests (any
VU) reuse it. The plugin owns a single Tokio runtime and block_ons the async
client, because the protocol ABI is synchronous and carries no per-VU context
across the FFI boundary.
Testing against a real server
The example harness brings up rabbitmq:3.13-management with the loadr user
and a loadr.work queue pre-declared from definitions.json:
docker compose -f examples/harness/docker-compose.yml up -d rabbitmq

LOADR_TEST_AMQP_URL=amqp://loadr:loadr@127.0.0.1:5672/%2f \
  cargo test -p loadr-plugin-rabbitmq
The integration tests no-op when LOADR_TEST_AMQP_URL is unset.
Developing a plugin
A practical walkthrough — we'll build, test and ship the uppercase-extractor
WASM plugin (the same one in plugins/examples/wasm-extractor).
1. Scaffold
cargo new --lib uppercase-extractor && cd uppercase-extractor
mkdir wit && cp <loadr repo>/crates/loadr-plugin-api/wit/loadr.wit wit/
[package]
name = "uppercase-extractor"
version = "0.1.0"
edition = "2021"

[lib]
crate-type = ["cdylib"]

[dependencies]
wit-bindgen = "0.58"
serde_json = "1"
2. Implement
#![allow(unused)]
fn main() {
wit_bindgen::generate!({ path: "wit", world: "loadr-plugin" });

struct Plugin;

impl exports::loadr::plugin::meta::Guest for Plugin {
    fn describe() -> exports::loadr::plugin::meta::Info {
        exports::loadr::plugin::meta::Info {
            name: "uppercase-extractor".into(),
            version: env!("CARGO_PKG_VERSION").into(),
            kind: "extractor".into(),
            description: "boundary extractor that upper-cases the match".into(),
        }
    }
}

impl exports::loadr::plugin::extractor::Guest for Plugin {
    fn extract(body: Vec<u8>, _headers: Vec<(String, String)>, config: String) -> Option<String> {
        let cfg: serde_json::Value = serde_json::from_str(&config).ok()?;
        let (left, right) = (cfg["left"].as_str()?, cfg["right"].as_str()?);
        let text = String::from_utf8_lossy(&body);
        let start = text.find(left)? + left.len();
        let end = text[start..].find(right)? + start;
        Some(text[start..end].to_uppercase())
    }
}

export!(Plugin);
}
3. Build & package
rustup target add wasm32-wasip2
cargo build --release --target wasm32-wasip2

mkdir dist
cp target/wasm32-wasip2/release/uppercase_extractor.wasm dist/
cat > dist/plugin.toml <<'EOF'
[plugin]
name = "uppercase-extractor"
version = "0.1.0"
kind = "extractor"
type = "wasm"
entry = "uppercase_extractor.wasm"
description = "Boundary extractor that upper-cases the match"
EOF
4. Install & use
loadr plugin install ./dist
loadr plugin info uppercase-extractor
plugins: [ { name: uppercase-extractor, config: { left: "token=", right: ";" } } ]
5. Publish to the index
A locally-installed directory is enough for development, but to make your
plugin installable by name (loadr plugin install <name>) it has to appear in
the plugin index — the catalogue described in
Installing plugins.
For each supported host target, package the plugin.toml plus the built
dynamic library into an archive (.tar.gz on Linux/macOS, .zip on Windows),
name it <name>-<target>.<ext>, and add an entry to plugins/index.json:
{
  "schema": 1,
  "plugins": {
    "myproto": {
      "kind": "protocol",
      "description": "…",
      "latest": "0.1.0",
      "versions": {
        "0.1.0": {
          "min_loadr_abi": "1.0",
          "artifacts": {
            "x86_64-unknown-linux-gnu": {
              "url": "https://…/myproto-x86_64-unknown-linux-gnu.tar.gz",
              "sha256": "<sha256 of the archive>",
              "entry": "libloadr_plugin_myproto.so"
            }
          }
        }
      }
    }
  }
}
The release CI fills in the real url/sha256 per target; bump
min_loadr_abi to the host ABI your build requires (the
LOADR_PLUGIN_ABI_VERSION you compiled against). The entry is the
per-platform artifact filename (libloadr_plugin_<name>.so /
.dylib / loadr_plugin_<name>.dll) and must match the entry inside the
archive's plugin.toml.
Until the index goes live you can hand a tester an archive directly:
loadr plugin install ./myproto-x86_64-unknown-linux-gnu.tar.gz --allow-untrusted
Testing tips
- Drive the component directly in a Rust test with
loadr_plugin_api::WasmExtractor::load(path)— exactly what loadr's own test suite does for the examples. - For native plugins: build with
cargo build, thenNativePlugin::load("target/debug/libmy_plugin.so")in a test. - Keep configs JSON-serializable and document them in your README; loadr
passes the
config:value through verbatim.
Versioning rules
- WASM: the WIT package version (
loadr:plugin@0.1.0) is the contract. - Native:
abi_stablelayout checking is the contract; additionally the root module carriesabi_version— bump on breaking changes and loadr will refuse mismatches with a clean message.
Native protocol plugins
A protocol plugin adds a new load-test target (a database, a queue, a
bespoke wire protocol). It must be a native plugin — WASM plugins can only be
extractors/assertions. loadr-plugin-mongo is the reference implementation; see
the MongoDB plugin for an end-to-end example.
The ABI
A protocol plugin implements the synchronous FfiProtocol trait and exports it
via make_protocol:
#![allow(unused)]
fn main() {
use loadr_plugin_api::abi::{FfiProtocol, FfiProtocolBox, FfiProtocol_TO, PluginMod, LOADR_PLUGIN_ABI_VERSION};
use loadr_plugin_api::{FfiRequest, FfiResponse};
use abi_stable::std_types::{RString, ROption::{RNone, RSome}};

struct MyProto;

impl FfiProtocol for MyProto {
    fn name(&self) -> RString { RString::from("myproto") }
    fn execute(&self, request_json: RString) -> RString {
        // parse FfiRequest JSON, run the op, return FfiResponse JSON.
        // MUST NOT panic — report failures via the response `error` field.
    }
}

extern "C" fn make_protocol() -> FfiProtocolBox {
    FfiProtocol_TO::from_value(MyProto, abi_stable::erased_types::TD_Opaque)
}

extern "C" fn plugin_info() -> RString { /* PluginInfo JSON, incl. "schemes" */ }

loadr_plugin_api::export_loadr_plugin! {
    PluginMod {
        abi_version: LOADR_PLUGIN_ABI_VERSION,
        info: plugin_info,
        make_output: RNone,
        make_protocol: RSome(make_protocol),
        make_service: RNone,
    }
}
}
Key facts that shape the design:
executeis synchronous, takes&self, and runs on one shared instance (Send + Sync) created once viamake_protocol(). There is no per-VU context across the FFI boundary.- A plugin that drives an async client (most do) must therefore own its async
machinery: create its own Tokio runtime inside the cdylib and
block_on, and keep an internal connection pool keyed by the connection target (e.g.OnceCell<Mutex<HashMap<String, Client>>>), reused across every call and VU. Do not connect per request. - Build the crate as
crate-type = ["cdylib"],publish = false, a member of the workspace underplugins/.
Request / response JSON
The host serializes a loadr_plugin_api::FfiRequest to JSON and hands it to
execute; the plugin returns a FfiResponse as JSON:
// FfiRequest (host -> plugin)
{
  "name": "find users",          // metric `name` tag
  "method": "POST",
  "url": "mongodb://h:27017/db",  // the connection target / URL
  "headers": [["k", "v"]],
  "body_b64": "",                 // base64 request body
  "timeout_ms": 30000,
  "options": { ... },             // the request's `plugin:` block, ${...}-interpolated
  "config": { ... }               // merged plugin config (manifest [config] + PluginRef.config)
}

// FfiResponse (plugin -> host)
{
  "status": 1,                    // your convention; non-failed by default
  "status_text": "OK",
  "headers": [],
  "body_b64": "",
  "duration_ms": 1.7,
  "error": null,                  // Some(msg) => request is marked failed
  "extras": { "docs": 3 }         // free-form; the host can read fields out (see below)
}
The host already interpolates ${...} in the request's plugin: block before
the plugin sees it, so options arrives fully rendered.
Declaring the URL scheme(s) — routing contract
A runtime-loaded plugin cannot edit core, so it declares the URL scheme(s) it
serves and the host wires up routing automatically. Declare schemes in two
places (the manifest wins; info() is the fallback when a plugin is loaded by
bare path):
# plugin.toml
[plugin]
name = "myproto"
kind = "protocol"
type = "native"
entry = "libmyproto.so"
schemes = ["myproto", "myp"]      # URL schemes this plugin claims
#![allow(unused)]
fn main() {
// plugin_info() JSON
{ "name": "myproto", "kind": "protocol", "schemes": ["myproto", "myp"], ... }
}
When the host loads the plugin it registers those schemes with a process-global
scheme router (loadr_core::protocol::register_plugin_schemes). After that,
ProtocolRegistry::infer resolves a URL like myproto://host/... to the
handler whose name() is myproto. Built-in schemes always win over plugin
aliases, and an explicit protocol: myproto in YAML also resolves (it must
match the plugin handler's name(), which the validator accepts because it is
listed under plugins:).
So a test can target the plugin either way:
plugins: [ { name: myproto } ]
flow:
  - request: { url: "myproto://host/...", plugin: { ... } }   # routed by scheme
  - request: { url: "host/...", protocol: myproto, plugin: { ... } }  # routed by name
Metrics
The host derives a metric family from the handler name() for plugin
protocols, emitting <name>_reqs (counter), <name>_req_duration (trend), and
— when the response includes extras.docs — <name>_docs (counter). A response
with a non-null error increments http_req_failed. So loadr-plugin-mongo
(name mongo) produces mongo_reqs / mongo_req_duration / mongo_docs
without any core changes per plugin.
Testing
- Unit-test the
execute/handlelogic by buildingFfiRequestJSON and asserting on theFfiResponse— no host needed. - Integration-test against a real backend behind an env-var gate (e.g.
LOADR_TEST_MONGO_URL) so CI skips it when the service is absent; bring the service up viaexamples/harness/docker-compose.yml. - End-to-end, load the built artifact with
loadr_plugin_api::NativePlugin::load("target/debug/libmyproto.so").
Publishing a plugin
Once a plugin is written (see Developing a plugin), this is how
its compiled artifacts get built for every platform, attached to a GitHub
Release, and advertised in the plugin index so users can run
loadr plugin install <name>.
This is automated by the Publish plugins workflow
(.github/workflows/publish-plugins.yml). You normally only push a tag; the
workflow does the rest.
What gets built
The workflow discovers every crate under plugins/loadr-plugin-* that ships a
plugin.toml and builds a cdylib (crate-type = ["cdylib"]). The
loadr-plugin-webui service crate has no plugin.toml and is skipped.
Each discovered plugin is built for all five targets loadr ships:
| Target triple | Runner | Library file |
|---|---|---|
x86_64-unknown-linux-gnu | ubuntu-latest | lib<lib>.so |
aarch64-unknown-linux-gnu | ubuntu-latest | lib<lib>.so |
x86_64-apple-darwin | macos-latest | lib<lib>.dylib |
aarch64-apple-darwin | macos-latest | lib<lib>.dylib |
x86_64-pc-windows-msvc | windows-latest | <lib>.dll |
<lib> is the crate's [lib] name (e.g. loadr_plugin_mongo).
Packaging & naming
Each build produces a flat tarball named after the manifest plugin name
([plugin].name, e.g. mongo — not the crate dir loadr-plugin-mongo):
<name>-<target>.tar.gz          # the cdylib, renamed to the platform `entry`,
                                # plus a plugin.toml whose `entry` matches
<name>-<target>.tar.gz.sha256   # hex SHA-256 of the archive
The library inside the archive is renamed to the platform-correct entry
(.so/.dylib/.dll), and the bundled plugin.toml's entry = line is
rewritten to match, so the archive installs cleanly on any OS.
The plugin index
plugins/index.json (served at
https://raw.githubusercontent.com/levantar-ai/loadr/main/plugins/index.json)
is the default catalogue the installer resolves. The workflow regenerates it
from the built artifacts:
{
  "schema": 1,
  "plugins": {
    "mongo": {
      "kind": "protocol",
      "description": "MongoDB protocol: insert/find/update/delete/aggregate/command",
      "latest": "1.0.0",
      "versions": {
        "1.0.0": {
          "min_loadr_abi": "1.0",
          "artifacts": {
            "x86_64-unknown-linux-gnu": {
              "url": "https://github.com/levantar-ai/loadr/releases/download/plugin-v1.0.0/mongo-x86_64-unknown-linux-gnu.tar.gz",
              "sha256": "…",
              "entry": "libloadr_plugin_mongo.so"
            }
          }
        }
      }
    }
  }
}
Regeneration merges into the existing index, so prior plugins, versions and
targets are preserved; latest is recomputed as the highest semver per plugin.
The refreshed index is committed back to main so the default URL serves it
immediately.
Cutting a release
-
Land your plugin crate on
main(with itsplugin.toml). -
Set the workspace version if needed (
scripts/set-version.sh <x.y.z>), and make sure the plugin'splugin.tomlversionmatches. -
Push a release tag:
git tag plugin-v1.0.0
git push origin plugin-v1.0.0
The tag push triggers a real publish: build all targets, attest SLSA
provenance, create/append the plugin-v1.0.0 GitHub Release with every
*.tar.gz + *.tar.gz.sha256 + SHA256SUMS, regenerate plugins/index.json,
and commit it to main.
Because the enterprise org forces GITHUB_TOKEN to read-only, both the Release
upload and the index commit-back authenticate with the PAT_TOKEN secret — the
same pattern as release.yml.
Dry run (testing the workflow)
workflow_dispatch defaults to a dry run: it builds and packages every
plugin for every target (and attests provenance) but creates no Release and
pushes no index. Use it to validate packaging from a branch:
- Actions → Publish plugins → Run workflow → leave
dry_runchecked.
To publish for real from a manual run, uncheck dry_run and supply a tag
(e.g. plugin-v1.0.1).
Building locally
scripts/build-plugin.sh is the same packaging logic CI uses, runnable on your
machine:
# scripts/build-plugin.sh <crate-dir> <target-triple> [out-dir]
scripts/build-plugin.sh plugins/loadr-plugin-mongo x86_64-unknown-linux-gnu dist
It writes dist/<name>-<target>.tar.gz, its .sha256, and a
<name>-<target>.meta.json that scripts/gen-plugin-index.sh consumes to build
the index:
RELEASE_TAG=plugin-v1.0.0 scripts/gen-plugin-index.sh dist plugins/index.json
Migrating from k6
Two paths, freely mixed:
- Automatic:
loadr convert script.js -o test.yamltranslates options, scenarios, stages, thresholds, plainhttp.*calls,checks,sleeps andgroups into YAML, and preserves anything it can't translate as embedded JS with warnings. - Keep your script: loadr's JS API is deliberately k6-shaped — many scripts run nearly unchanged under a thin YAML wrapper:
js: { file: ./your-k6-script.js }
scenarios:
  default: { executor: constant-vus, vus: 10, duration: 5m, exec: default }
Concept map
| k6 | loadr |
|---|---|
export const options = { vus, duration } | scenario with constant-vus |
options.stages | ramping-vus + stages: |
options.scenarios.<name> | scenarios.<name> (same executor names) |
options.thresholds | thresholds: (same expression syntax) |
import http from 'k6/http' | works as-is |
check(res, {...}) | works as-is; or YAML checks: |
sleep(n) | works as-is; or YAML think_time |
group(name, fn) | works as-is; or YAML group: step |
Trend/Counter/Rate/Gauge | work as-is; or YAML metrics: |
__ENV.FOO | works as-is; or ${env.FOO} in YAML |
open('data.csv') + papaparse | data: block (CSV native) |
setup() / teardown() | identical lifecycle |
k6 run script.js | loadr run test.yaml |
| exit code 99 on threshold failure | identical |
| k6 Cloud / dashboards | built-in web UI + Prometheus/Grafana outputs |
| xk6 extensions | WASM / native plugins (no rebuild) |
What the converter handles
loadr convert covers the common 90%: vus/duration/stages/
iterations, the full options.scenarios matrix (camelCase →
snake_case), thresholds incl. abortOnFail/delayAbortEval, http.get/post/ put/del/patch/head/options/request with literal URLs/bodies/headers,
JSON.stringify bodies, check patterns (status equality, body.includes,
duration comparisons — others become js conditions), sleep (constant and
Math.random() uniform), group, custom metric declarations, and
recognized imports.
Anything else — loops, conditionals, custom logic — is preserved verbatim in
the js: block and listed as a warning, so the converted test always runs.
Differences to know
- Trend values: loadr's
res.duration_ms≈ k6'sres.timings.duration. The converter rewrites the common forms; review custom timing math. - Async: k6 scripts using top-level
await/http.asyncRequestneed restructuring into synchronous calls (QuickJS resolves returned promises, but the blocking API is the model). - Cookies: automatic jars per VU, same as k6; the
http.cookieJar()API is replaced bysession.cookieGet/Set/Clear. handleSummary(): replaced by--summary-export+loadr report.
Migrating from JMeter
loadr convert test-plan.jmx -o converted.yaml
loadr validate converted.yaml
loadr run converted.yaml
The converter parses JMeter 5.x plans and emits clean YAML, with a warning
for every element it couldn't translate (disabled elements, plugins,
${__functions}, complex controllers).
Concept map
| JMeter | loadr |
|---|---|
| Thread Group (threads, ramp-up, duration) | scenario: constant-vus / ramping-vus |
| Thread Group with loop count | per-vu-iterations |
| Multiple Thread Groups | multiple scenarios (run concurrently) |
| HTTP Request sampler | request: step |
| HTTP Header Manager | headers: (request- or defaults-level by scope) |
| HTTP Cookie Manager | defaults.http.cookies: true (default) |
| CSV Data Set Config | data: block |
| User Defined Variables | variables: |
| Constant / Uniform / Gaussian Random Timer | think_time: (same three types) |
| Constant Throughput Timer | pacing: (per-minute → per-second) |
| Response Assertion | assert: status / body_contains / body_matches |
| Duration / Size Assertion | assert: duration / size |
| JSON / XPath Assertion | assert: jsonpath / xpath |
| Regular Expression Extractor | extract: regex (incl. match no. → index) |
| JSON / XPath / Boundary Extractor | extract: jsonpath / xpath / boundary |
| CSS Selector Extractor | extract: css |
| Transaction Controller | group: step |
| Loop Controller | steps replicated (≤10) or warning |
| Backend Listener (InfluxDB/Graphite) | outputs: influxdb / prometheus / statsd |
| Aggregate Report / HTML dashboard | console summary + loadr report + web UI |
| Distributed testing (RMI, jmeter-server) | loadr controller / loadr agent (gRPC, mTLS) |
| BeanShell / JSR223 / Groovy | embedded JavaScript |
What changes for the better
- Percentiles are exact (HDR histograms), including across the fleet — JMeter's distributed mode ships raw samples or averages, loadr merges histograms.
- Open-model load: JMeter's thread-based model can't hold a target
request rate when the system slows down;
constant-arrival-ratecan. - Code review-able tests: YAML diffs instead of 4000-line XML.
- No JVM tuning, no plugin manager, one binary.
What needs hand-porting
- JMeter plugins (custom samplers etc.) → loadr protocol plugins.
${__time()},${__Random()},${__UUID()}and friends →${js: ...}one-liners (Date.now(),Math.random(),crypto.uuidv4()). The converter flags each occurrence.- If/While/Switch controllers → JS scenario functions (
exec:), where real control flow is natural. - Module/Include controllers → split scenarios across files and compose with environments or separate tests.
Recording a browser session (HAR)
You don't have to hand-write a test from scratch. Record a real session in your browser, export it as a HAR (HTTP Archive) file, and let loadr turn it into a test plan — with dynamic values auto-correlated for you.
loadr convert session.har -o test.yaml
loadr run test.yaml
Capturing a HAR
- Open your browser's developer tools and go to the Network tab.
- Tick Preserve log so navigations don't clear it.
- Do the journey you want to load test (log in, add to cart, check out…).
- Right-click any request → Save all as HAR with content.
That .har file is just JSON describing every request and response.
What loadr convert does
| Step | Behaviour |
|---|---|
| Drops static assets | Images, CSS, JS and fonts are skipped — they're noise in a load test. The count is reported as a warning. |
| Extracts a base URL | The most common origin becomes defaults.http.base_url; matching requests become relative paths. |
| Builds one request per call | Method, URL, headers (minus transport/cookie noise) and JSON/text bodies, in order, inside a recorded scenario. |
| Auto-correlates dynamic values | The headline feature — see below. |
| Leaves cookies alone | loadr's per-VU cookie jar replays Set-Cookie automatically, so cookies don't need correlating. |
The output is a normal loadr plan: review it, set real load, and run it.
Auto-correlation
Replaying a recording verbatim usually fails: the CSRF token, session id or order id from your recording is stale on the next run. Correlation fixes this by capturing those values from the live response and feeding them into later requests.
loadr convert does this automatically. It scans each JSON response for
dynamic-looking values — by field name (token, csrf, session, *_id, …)
and by shape (UUIDs, JWTs, long hex, numeric ids) — and, when the same value is
reused in a later request, it:
- adds an
extract:to the request that produced it, and - rewrites the literal in every later request to
${var}.
Before / after
A recorded login → add-to-cart → list-orders flow. The recording contains a literal CSRF token and user id:
# what a naive replay would contain (stale on the next run):
- request: { method: POST, url: /api/login, body: { json: { username: alice } } }
- request:
    method: POST
    url: /api/cart/items
    headers: { X-CSRF-Token: "<token-captured-while-recording>" }   # stale!
- request: { method: GET, url: /api/users/<recorded-user-id>/orders }   # stale!
loadr convert session.har produces, instead:
- request:
    name: POST /api/login
    url: /api/login
    body: { json: { username: alice } }
    extract:
    - { type: jsonpath, name: csrftoken, expression: $.csrfToken }
    - { type: jsonpath, name: id,        expression: $.user.id }
- request:
    name: POST /api/cart/items
    url: /api/cart/items
    headers: { X-CSRF-Token: "${csrftoken}" }   # captured per run
- request:
    name: GET /api/users/${id}/orders           # captured per run
Try it on the bundled sample:
loadr convert examples/recordings/example.har
Limits — read the output
Auto-correlation is a best-effort heuristic, not magic. In this version:
- It correlates values found in JSON response bodies (the common case for APIs). Values that only appear in HTML or non-JSON bodies aren't correlated yet — wire those by hand with an extractor.
- Cookies are deliberately left to the cookie jar.
- It matches on the exact value, so a value that changes shape between requests (e.g. URL-encoded in one place, raw in another) may be missed.
Every correlation is reported as a warning so you can review it. Treat the
output as a strong first draft: check the correlations, set a real
executor/vus/duration, and add assertions before you run load.
HTML reports & time-series charts
loadr report turns a summary JSON export into a single, self-contained HTML
file you can share with people who don't run loadr. It contains:
- Time-series charts — throughput, response-time percentiles, active VUs and error rate plotted against elapsed run time.
- The aggregate tables — thresholds, checks, latency trends, and counters/rates/gauges, exactly as the console summary reports them.
The file references no external assets: the charts are inline SVG drawn by a small inline script, and all styling is inline CSS. It opens offline and is safe to attach to an email or commit to a repo.
Generating a report
loadr run --summary-export results.json test.yaml
loadr report results.json -o report.html
loadr report accepts any summary JSON produced by --summary-export,
including one fetched from a controller's /api/runs/{id}/summary endpoint in
distributed mode.
The charts
Four charts are rendered from the run timeline:
| Chart | Series | Source |
|---|---|---|
| Throughput | requests/s, iterations/s | per-interval http_reqs / iterations counts |
| Response time | p50, p95, p99, avg (ms) | http_req_duration percentiles |
| Active VUs | virtual users | vus gauge |
| Error rate | failed % | http_req_failed rate |
Each chart shares a hover crosshair: move the pointer over any chart and a dashed line tracks the nearest interval in all four charts at once, with the exact values for that instant printed beneath. This makes it easy to correlate, say, a latency spike with the moment VUs ramped up.
A ramping or spike profile produces the most interesting shape — see
examples/24-timeseries-report.yaml,
which warms up, spikes to ~5x load, then recovers.
How the timeline is captured
During a run the engine snapshots the aggregator once per snapshot interval
(1 s by default; --snapshot-interval to change it). Each snapshot is reduced
to one compact timeline point and appended to the summary. In distributed
mode the controller samples the centrally merged snapshot at the same cadence,
so the timeline reflects the whole fleet.
Timeline latency percentiles are the live, count-weighted merge across tag sets — accurate enough for visual analysis. The aggregate tables remain the exact end-of-run figures (merged from HDR histograms), so a threshold and its chart may differ by a hair; trust the table for pass/fail.
timeline in the results JSON
The summary export gains a top-level timeline array. It is additive —
existing fields are unchanged, and reports from before this feature (no
timeline) still render, just without charts.
{
  "name": "timeseries-report",
  "run_id": "...",
  "duration_secs": 50.0,
  "metrics": [ "..." ],
  "thresholds": [ "..." ],
  "snapshot": { "...": "final per-tag snapshot" },
  "timeline": [
    {
      "elapsed_secs": 1.0,
      "rps": 48.0,
      "iterations_ps": 24.0,
      "active_vus": 5.0,
      "error_rate": 0.0,
      "latency_avg": 12.4,
      "latency_p50": 9.0,
      "latency_p95": 31.0,
      "latency_p99": 58.0
    }
  ]
}
| Field | Meaning |
|---|---|
elapsed_secs | seconds since the run started |
rps | requests/s over the interval |
iterations_ps | completed iterations/s over the interval |
active_vus | active virtual users at that instant |
error_rate | failed-request fraction over the interval, 0-1 |
latency_avg / latency_p50 / latency_p95 / latency_p99 | http_req_duration in ms; omitted when no requests had completed yet |
One point is emitted per snapshot interval, plus a trailing point covering the
residual window so even sub-interval runs produce a timeline. The latency
fields are omitted (rather than null) when there is no sample yet, so charts
simply start once traffic begins.
Built-in metrics
Kinds: Counter (sum), Gauge (last/min/max), Rate (pass fraction), Trend (HDR histogram: avg/min/med/max + any percentile).
Core
| Metric | Kind | Meaning |
|---|---|---|
iterations | Counter | completed iterations |
iteration_duration | Trend | full iteration time (ms) |
dropped_iterations | Counter | arrival-rate starts skipped (no free VU at max_vus) |
vus | Gauge | active virtual users |
vus_max | Gauge | peak VUs |
checks | Rate | check pass rate (tag check = name) |
vu_exceptions | Counter | uncaught JS exceptions in hooks/exec/js steps (tags exception = normalised message, site) |
data_sent / data_received | Counter | bytes on the wire |
HTTP (and GraphQL)
| Metric | Kind |
|---|---|
http_reqs | Counter |
http_req_duration | Trend (sending + waiting + receiving) |
http_req_blocked | Trend (connection acquisition) |
http_req_connecting | Trend (TCP) |
http_req_tls_handshaking | Trend |
http_req_sending / http_req_waiting / http_req_receiving | Trend |
http_req_failed | Rate (transport error or status ≥ 400; transport failures carry an error_kind tag) |
Other protocols
| Metric | Kind |
|---|---|
ws_connecting, ws_session_duration | Trend |
ws_msgs_sent, ws_msgs_received | Counter |
grpc_reqs / grpc_req_duration | Counter / Trend |
graphql_reqs / graphql_req_duration | Counter / Trend |
tcp_reqs / tcp_req_duration | Counter / Trend |
udp_reqs / udp_req_duration | Counter / Trend |
Standard tags
scenario, name (request name), method, status, proto, group
(::outer::inner), check (on checks samples), error_kind (on
http_req_failed transport failures), exception / site (on
vu_exceptions), instance (agent name in distributed runs), plus everything
from defaults.tags, scenario tags: and request tags:.
Custom metrics
Declare in YAML for threshold validation, or create ad hoc from JS:
metrics:
  carts_created: { kind: counter }
  render_time: { kind: trend, time: true }
new Counter('carts_created').add(1);
session.trendAdd('render_time', 16.6);
Exit codes
| Code | Meaning | Notes |
|---|---|---|
0 | success | run completed, every threshold passed |
1 | error | invalid test definition, I/O failure, connection to controller failed, ... |
99 | thresholds failed | run completed (or was aborted by abort_on_fail); k6-compatible |
130 | interrupted | second Ctrl-C (the first triggers a graceful stop with summary) |
CI example:
- name: Load test gate
  run: loadr run -e ci --summary-export results.json perf/checkout.yaml
  # job fails automatically on exit 99

- name: Publish report
  if: always()
  run: loadr report results.json -o report.html
JSON Schema & editor setup
loadr's YAML format ships as a JSON Schema generated from the same types the parser uses — autocomplete and inline validation can never drift from reality.
loadr schema > loadr.schema.json
VS Code (YAML extension)
// .vscode/settings.json
{
  "yaml.schemas": {
    "./loadr.schema.json": ["**/loadtests/**/*.yaml", "**/*.loadr.yaml"]
  }
}
Or per file:
# yaml-language-server: $schema=./loadr.schema.json
name: my-test
JetBrains IDEs
Settings → Languages & Frameworks → Schemas and DTDs → JSON Schema Mappings →
add loadr.schema.json with your test file pattern.
Neovim
require('lspconfig').yamlls.setup {
  settings = { yaml = { schemas = { ["./loadr.schema.json"] = "loadtests/**/*.yaml" } } }
}
CI validation without an editor
loadr validate --format json loadtests/*.yaml
gives you the same diagnostics (path, line, column, message, suggestion) as machine-readable JSON.
Credits & influences
loadr stands on the shoulders of the load-testing tools that came before it. It is not a fork of any of them — it's a fresh implementation in Rust — but its design borrows the best ideas from four projects, deliberately and gratefully.
k6 — the model
loadr's core execution model is k6's. The seven executors
(constant-vus, ramping-vus, constant-arrival-rate, ramping-arrival-rate,
per-vu-iterations, shared-iterations, externally-controlled), the
open/closed load distinction, the four metric types (Counter, Gauge, Rate,
Trend), thresholds as pass/fail criteria with abortOnFail and exit code 99,
checks, groups, tags, and the embedded-JavaScript developer experience all
follow k6's semantics — so much so that the JS API is import-compatible
(import http from 'k6/http') and loadr convert imports k6 scripts directly.
Apache JMeter — the arsenal
JMeter's breadth of assertions, extractors and timers shaped loadr's request
toolkit: response/duration/size/JSONPath/XPath assertions, the regular
expression / boundary / CSS / XPath extractors, the constant / uniform /
gaussian timers and the constant-throughput timer (loadr's pacing), CSV data
sets with shared/per-thread cursors and recycle/stop-at-EOF, and cookie
management. loadr convert reads .jmx plans so you can bring decades of
existing tests with you.
Gatling — the DSL
Gatling contributed the flow control and injection vocabulary: the
repeat / while / if-else loops and conditionals, the
randomSwitch / uniformRandomSwitch / roundRobinSwitch branch selection
(loadr's random step), the feeder strategies (sequential / random /
shuffle), JSON feeders, and the request-rate throttle (reachRps). Gatling's
rich, assertion-driven simulation reports also informed loadr's HTML report.
Locust — the behaviour model
Locust's weighted-task model — users that pick @task(weight) actions at
random rather than running a fixed script — is exactly what loadr's weighted
random step expresses. Locust's clean real-time web UI was a direct
inspiration for loadr's built-in management UI, and its straightforward
distributed master/worker model informed loadr's controller/agent design.
What loadr adds
The combination is the point — k6's model and JMeter's arsenal and
Gatling's DSL and Locust's behaviour model in one binary — plus a few things
none of them ship together: a single static binary with no runtime
(no JVM, no Python, no Go toolchain, no protoc, no OpenSSL); mathematically
correct distributed percentiles via HDR-histogram merging (not averaging); a
sandboxed WASM + native plugin system that needs no rebuild; six protocols
with per-phase timings; and a declarative, schema-validated YAML format you can
code-review.
Trademarks and project names belong to their respective owners. loadr is an independent project and is not affiliated with or endorsed by k6/Grafana Labs, the Apache Software Foundation, Gatling Corp, or the Locust project.